Data Preparation with Zoho DataPrep
Zoho DataPrep is an advanced self-service data preparation software that offers a comprehensive solution to prepare large volumes of data from multiple data sources. The Zoho DataPrep add-on contextually provides the data preparation functionality of Zoho DataPrep within Zoho Analytics. This lets you significantly improve the quality of your data by cleaning and preparing it before analysis.
- DataPrep during import
- Prepare data from a table
- DataPrep standalone versus DataPrep add on
- Data import from Zoho Analytics into DataPrep
- Export Data from Zoho DataPrep to Zoho Analytics
- Troubleshooting
- Solutions
DataPrep during import
If you have the Zoho DataPrep add on, you can import your data and use the Prepare Data option to cleanse and prepare your data during import.
The below steps explain how to invoke Prepare Data while importing:
- Choose the file to be imported.
- In the Create Table (Import) pane, click Prepare Data.
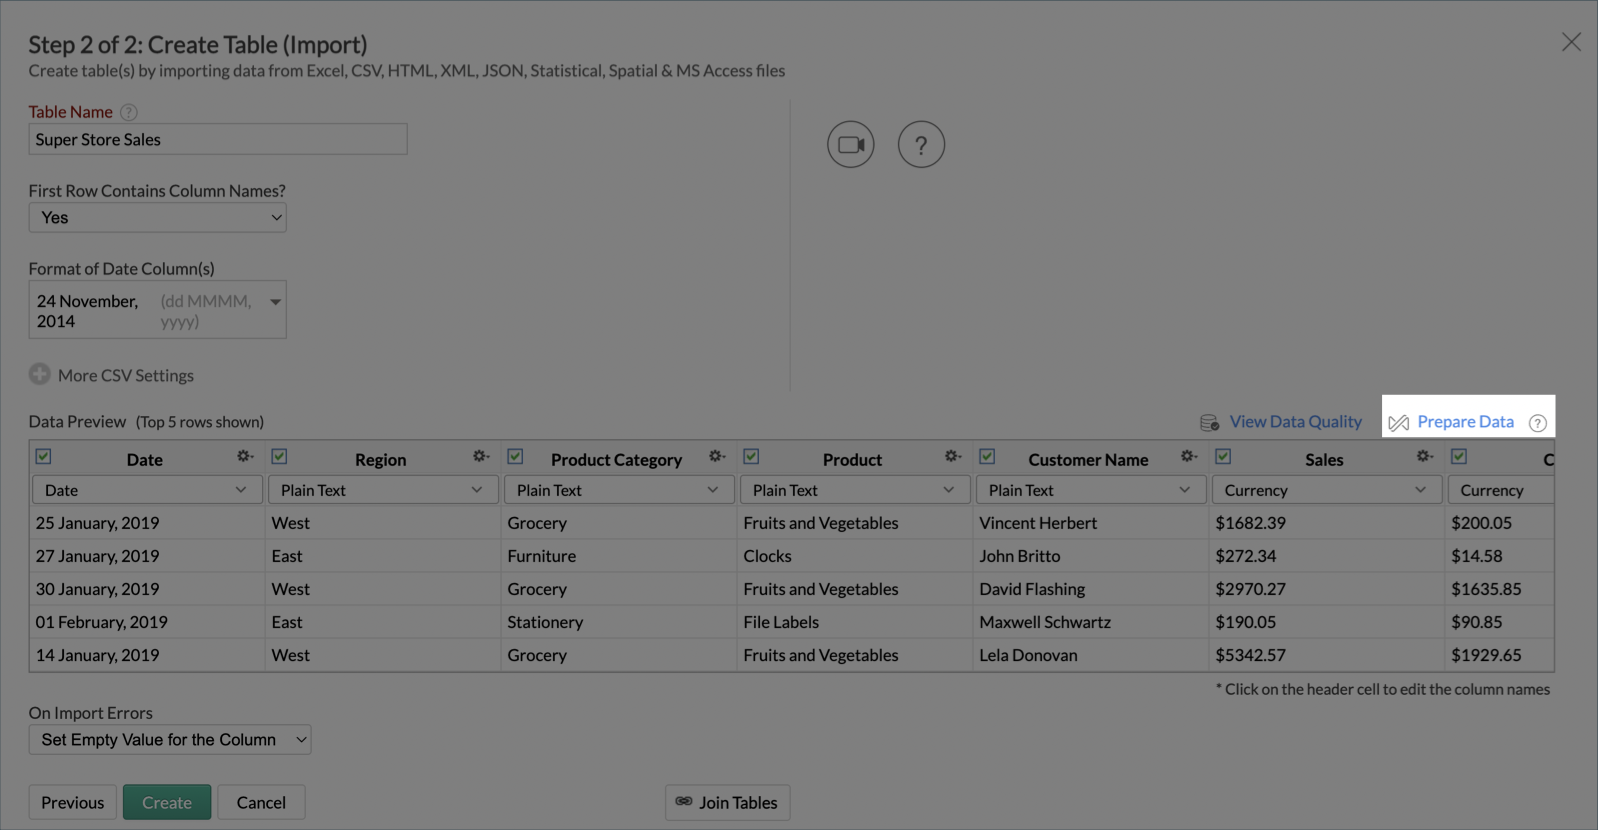
- The Prepare Data panel will open. You can apply various transformations such as changing number format, Find and Replace and define rulesets to enrich the data quality.
- Click Apply Changes.
The Create Table (Import) pane will open. You can review the Table settings such as Table Name, First Row Contains Column Name? and make changes if needed.
Note: The Format of Date Column and the CSV Settings (thousand separator and Decimal separator) cannot be changed after using Prepare Data.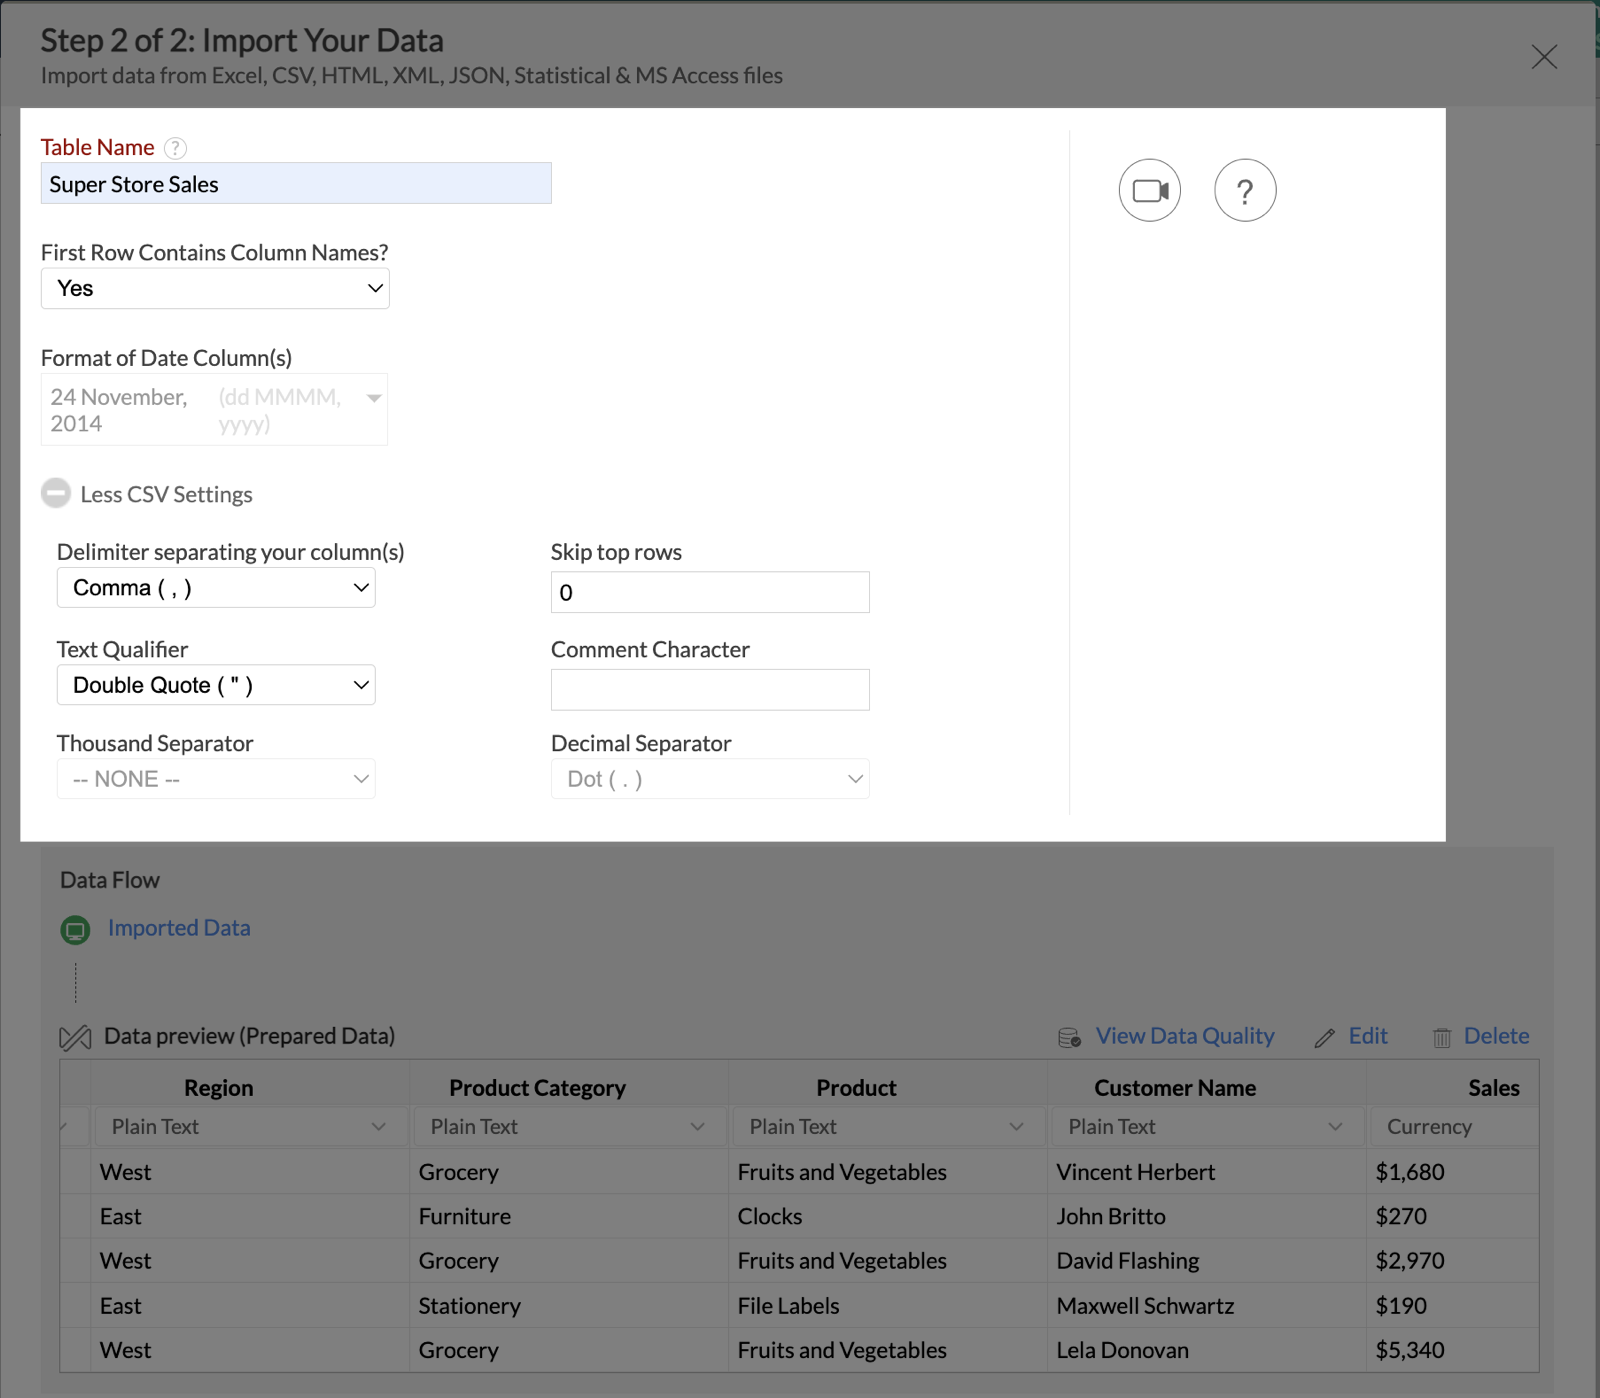


Prepare Data from a Table
In case you missed to check the data quality or prepare data while importing, you can always use the options under More, and click on the View Data Quality option to analyze the data quality of your table or use the Prepare
Data option to perform data transformations.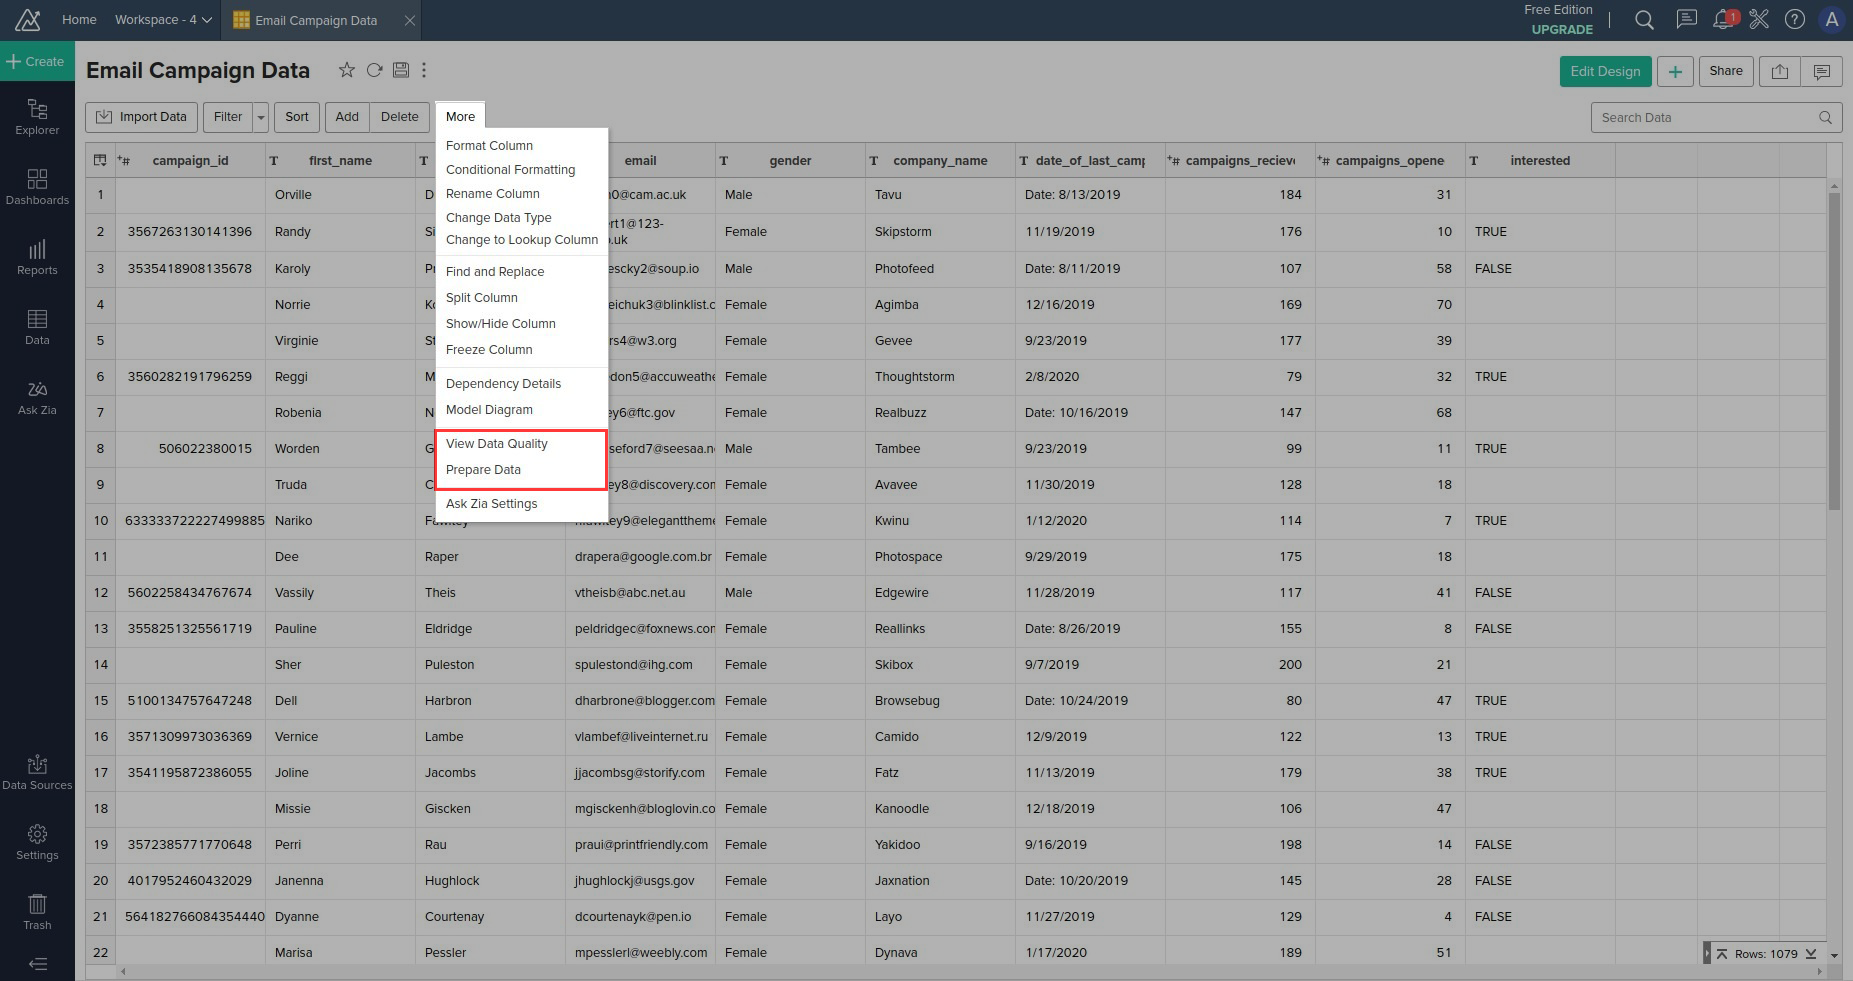
View Data quality
This option provides an overview about the table data quality. There are three sections in the Data quality analysis pane:
- Summary - lists the number of columns, rows, and data types available.
- Data quality - displays the data quality chart of the table.
- Column Level Data Quality - lists only the columns containing invalid data.
Prepare data
Clicking the Prepare data option will launch the data preparation pane. Let us look into the components available in the DataPrep pane.
Data quality bar
DataPrep offers numerous options to measure and improve the quality of your data. Data quality can be assessed from the following areas in the data prep pane.
A data quality bar represents the quality of data in each column. It splits data quality into valid data, invalid data, and missing values, based on data type of the column.
Green represents valid data, red represents invalid data, and grey represents the missing values. When you click on a section, DataPrep filters out appropriate rows so that you can easily deal with invalid or missing values in your dataset.
Hover over the data quality bar to get a quick look at the data quality of a column. The data quality chart specific to the column reveals the column data quality. You may choose to filter valid, invalid, and missing data in the column using the options provided.
Click Show for all columns option to display data quality for all columns.
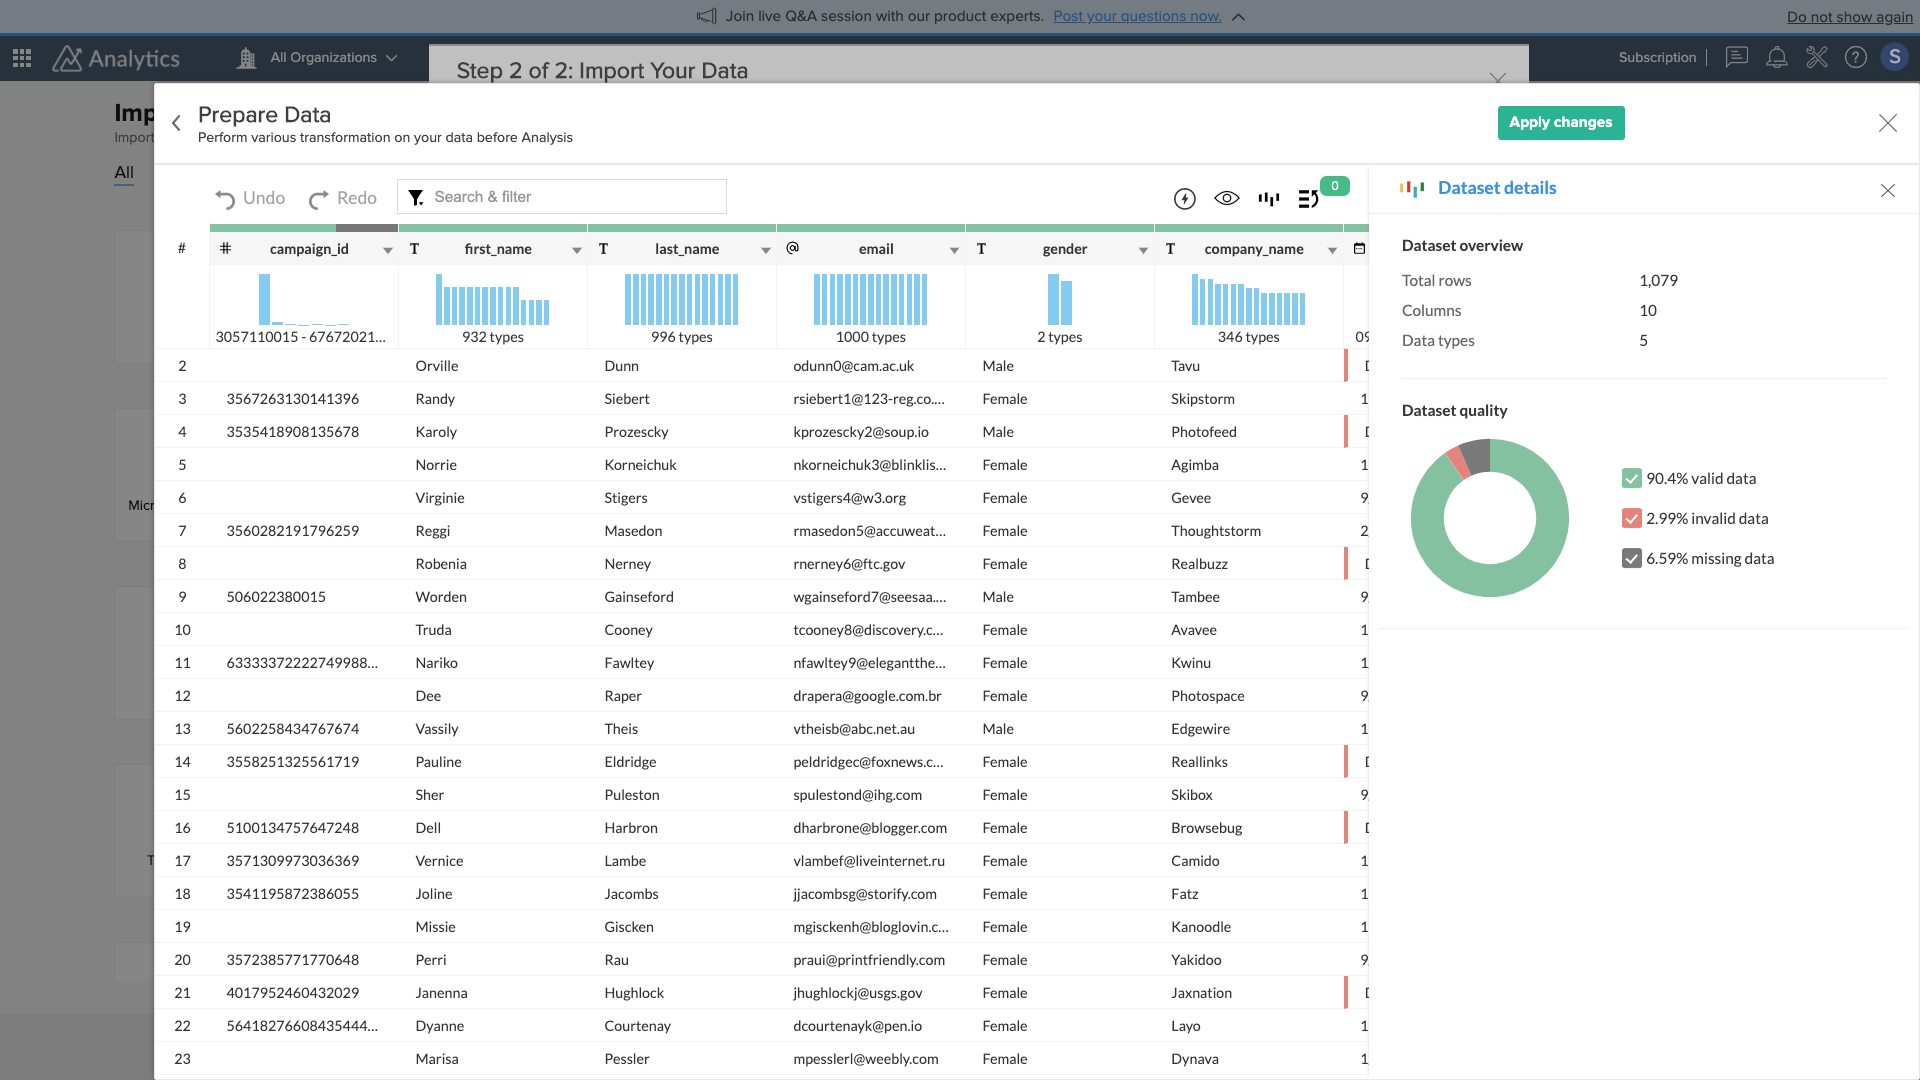
Dataset details
Dataset details reveal data quality for the entire dataset using a data quality chart. The number is derived from the collective quality of the individual columns.
You will see this section for the first time when a dataset loads onto the data preparation screen, and whenever none of the columns are selected.
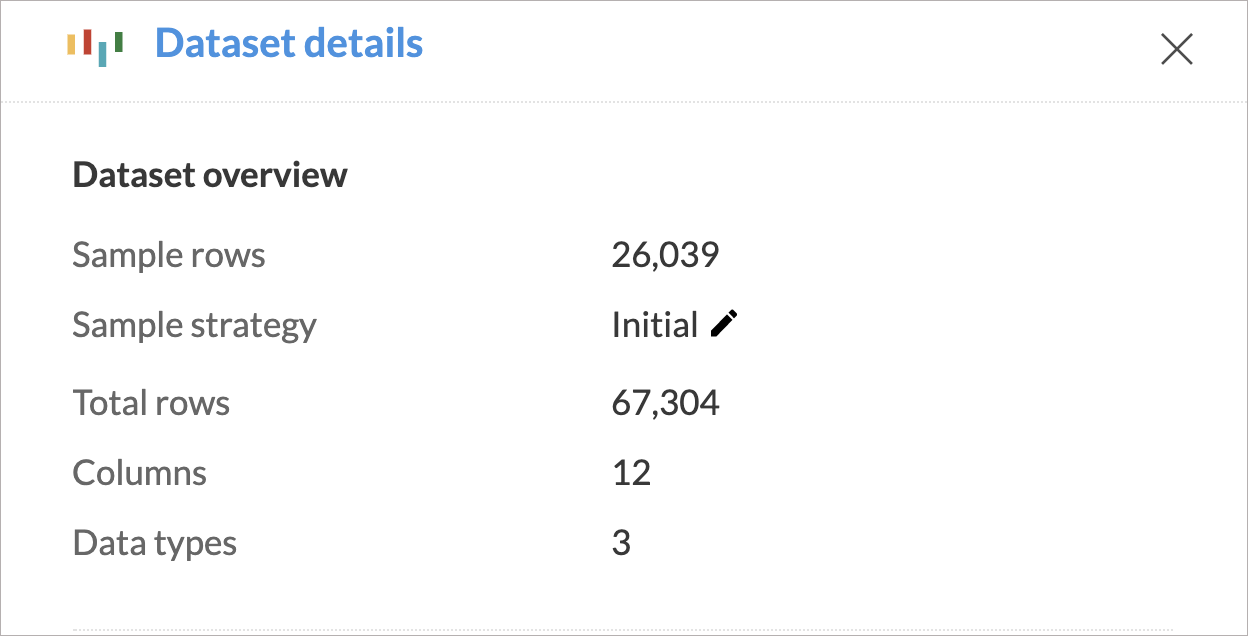
Dataset details display the following information.
- Sample size
- Sample strategy (includes Random, Erroneous, Column based, and Initial data samples)
- Number of rows
- Number of columns
- Number of data types in the dataset
If the imported data is small enough, the entire dataset will be imported for data preparation and the sample details will not be shown in the dataset details section.
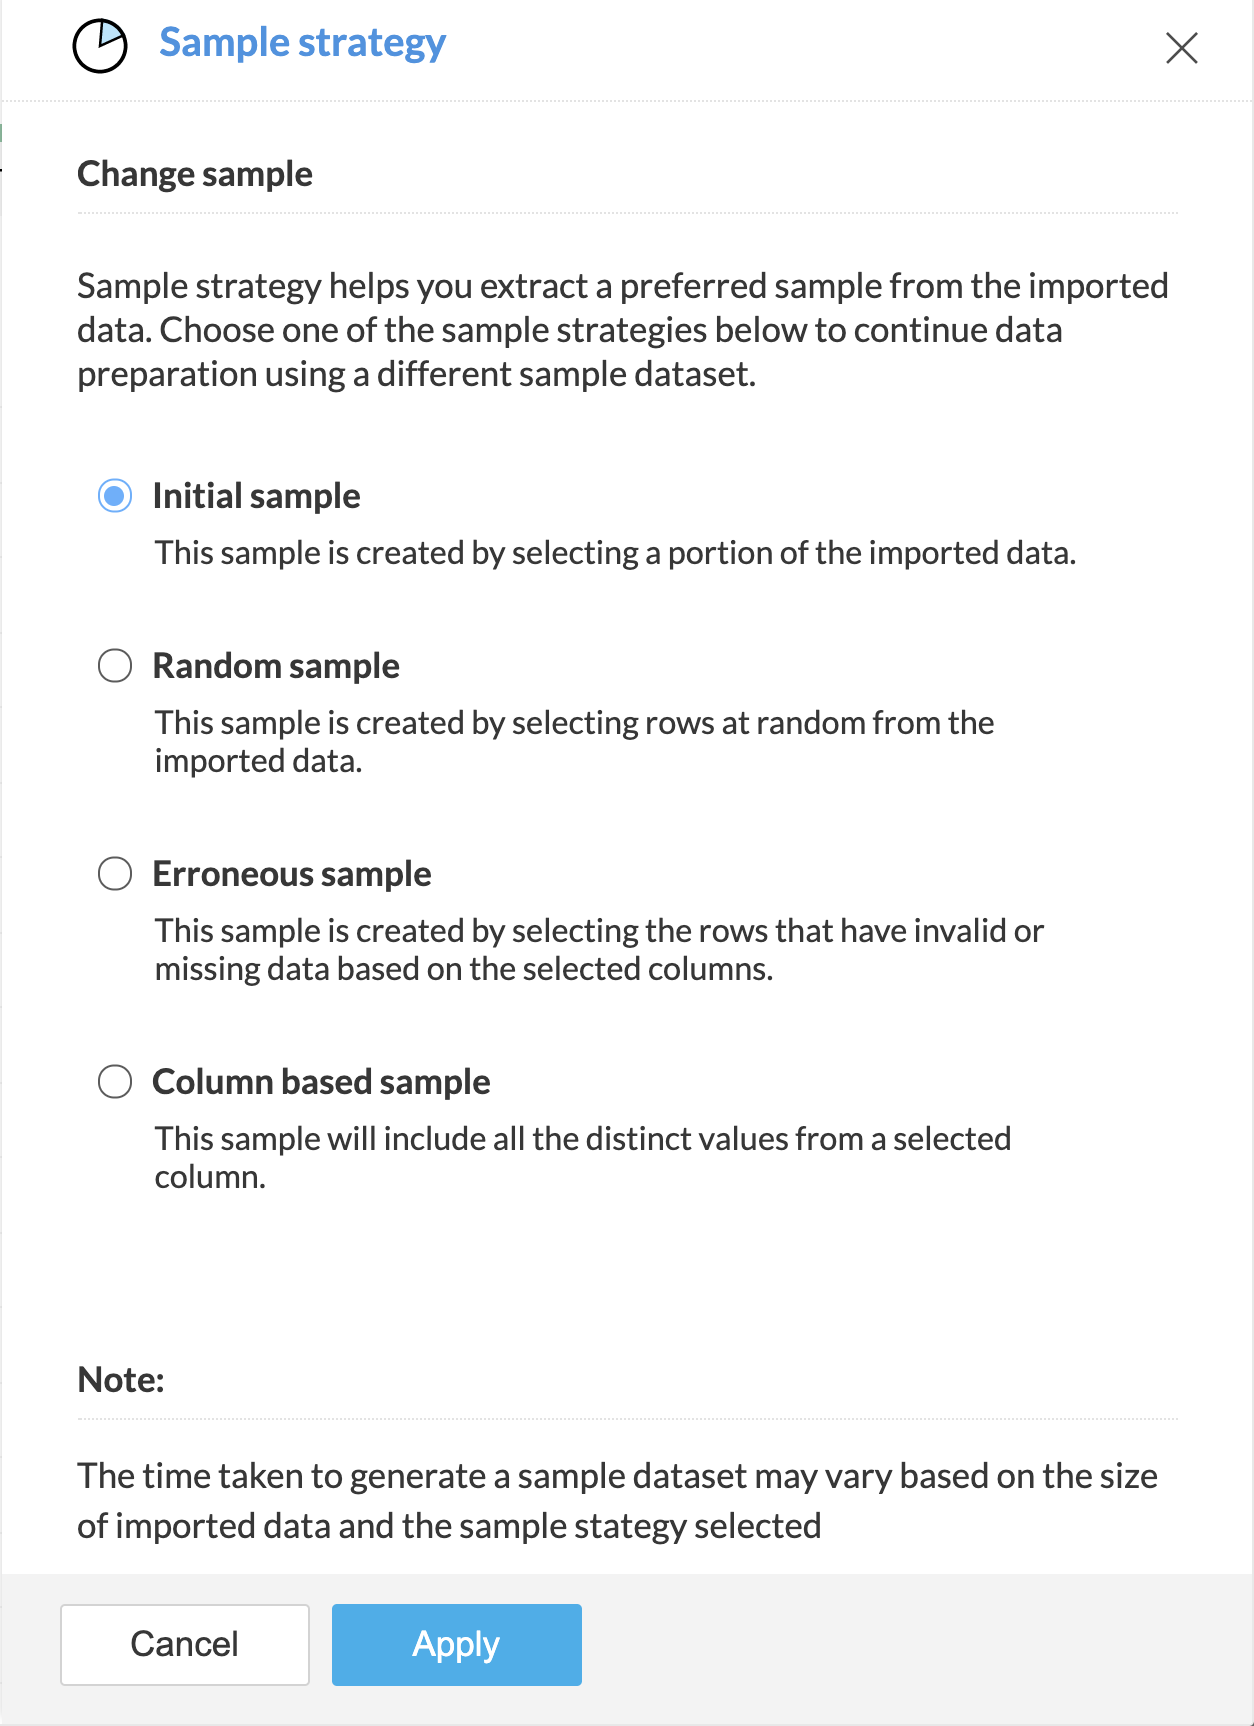
Sample strategy
Generating sample data based on the imported data is called Sample strategy. You can choose one of the four methods to create a sample. You can also change the strategy at any point during the data prep process. Click on the Edit icon to change the sample strategy.
The different sample strategies available are:
- Initial sample - Generated from the initial rows of the imported file.
- Random sample - Randomly selected rows from the imported file.
- Erroneous sample - Rows containing invalid or missing entries.
- Column based sample - Generated based on the distinct values from the selected column.
Data quality chart
The data quality chart splits data into a percentage of valid data, invalid data, and missing values. Click on the sections of the chart to selectively view valid data, invalid data, and missing values in your dataset. Here's a snapshot of data quality chart.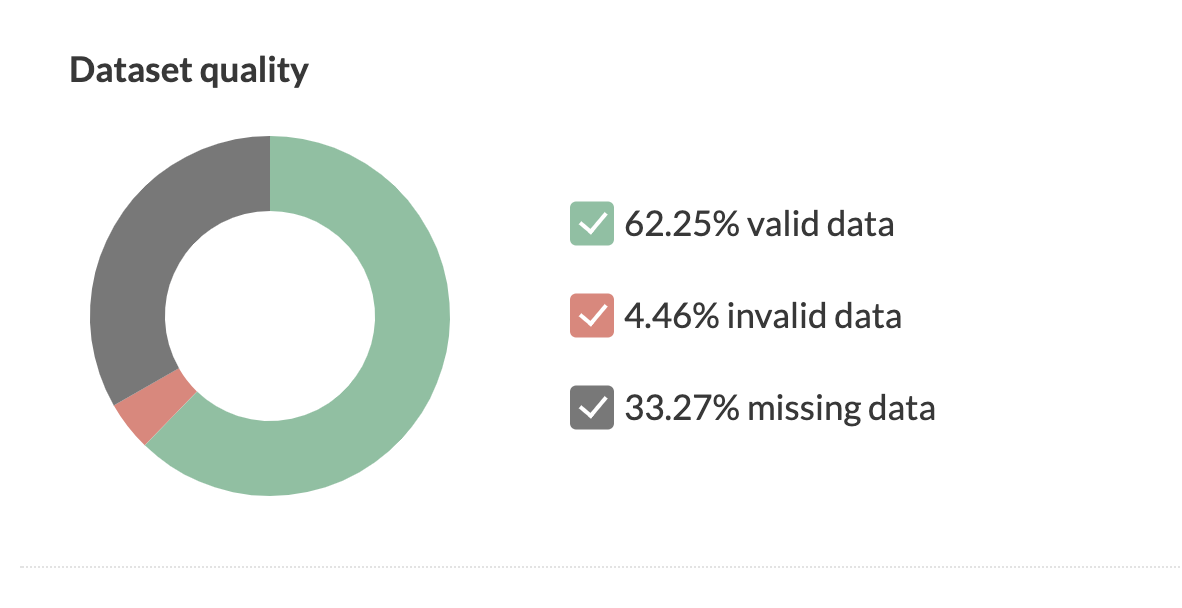
Data distribution
A graphical representation of data distribution and the range of values present in a column is shown at the top each column as a Histogram. Using the histogram, you can spot outliers and anomalies in the data. You can also select a bar of the histogram to filter the data within a specific range.
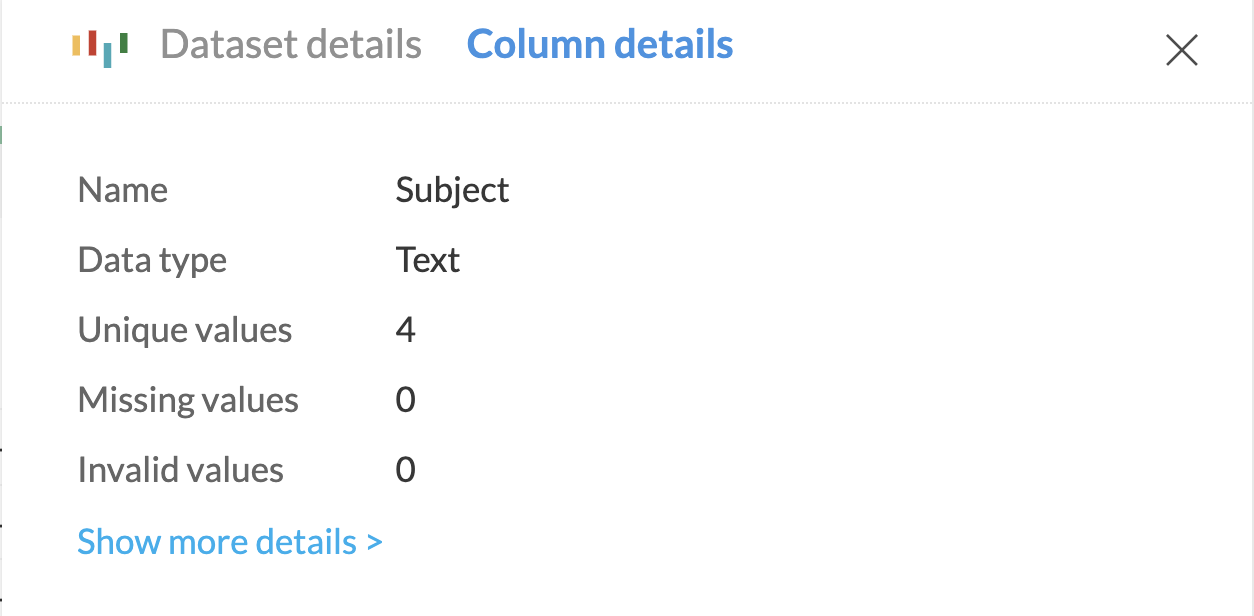
Column details
The Column details are shown in the side panel whenever a column is selected.
- The column details section shows a summary of each column with its data type, the number of unique values in the column, and the number of missing, invalid, and valid entries.
- You can change the data type of the column using the edit button next to the Data type option.
- You can also click the Show more details link to see the expanded view of the column details section.
Histogram
A detailed version of the histogram is present under Column details. You can search and filter the column data from this histogram. You can also edit the values present in the histogram and have it changed in the entire column as shown in the screenshot below. 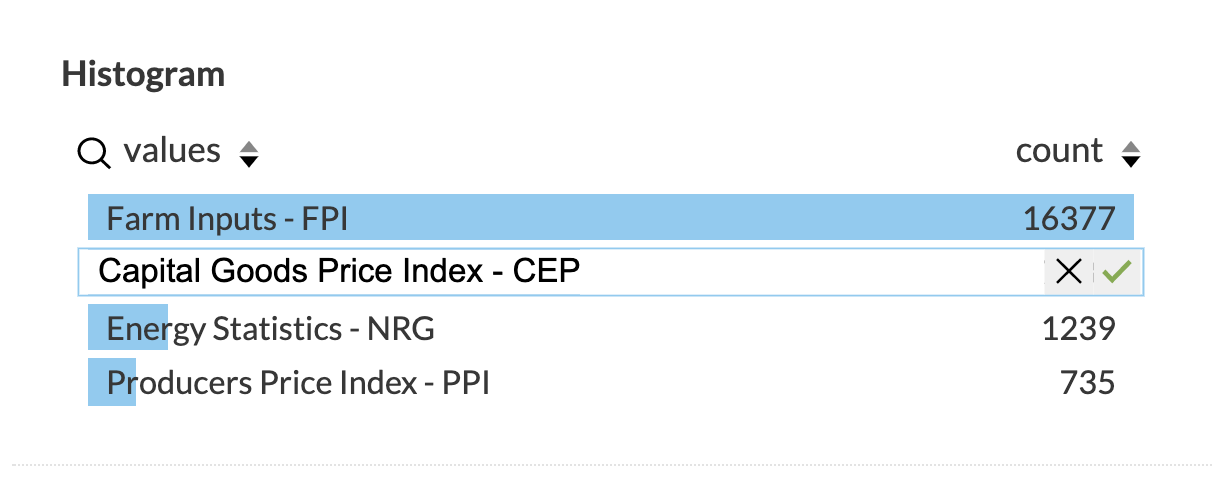
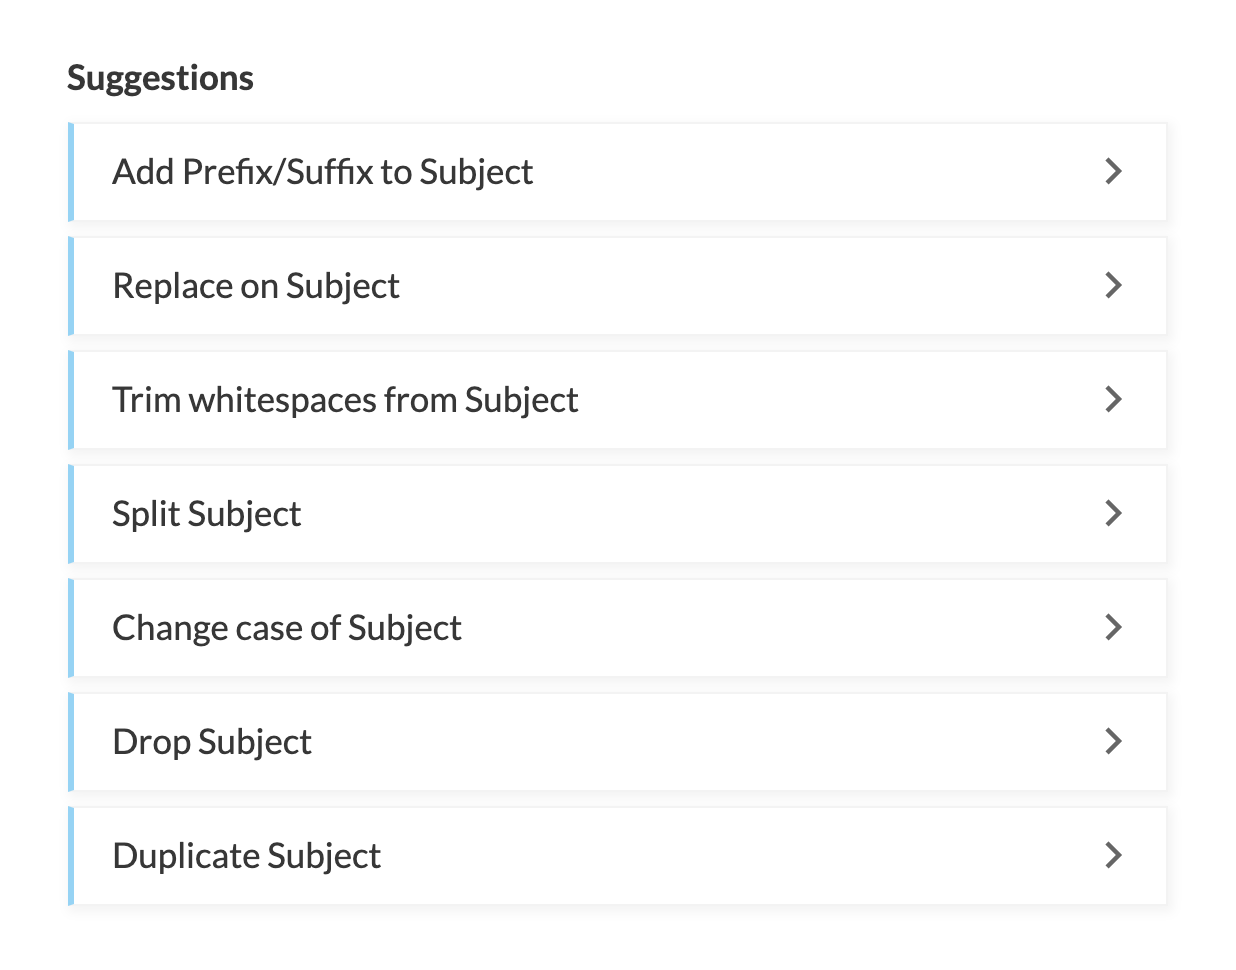
Intelligent Suggestions
You can also use the intelligent suggestions from DataPrep to resolve some of the common issues quickly and improve the data quality. DataPrep predicts the following operations based on the imported data and makes suggestions for effective data preparation. Column level transforms are suggested when a column is selected and dataset level transforms are suggested when no particular column is selected in the table.
- When you click one of the suggested operations, you will be taken to the Operations bar with a live preview of the transformation to be applied to your data.
- You may choose to edit the options and conditions in the operation bar before applying the suggested operation.
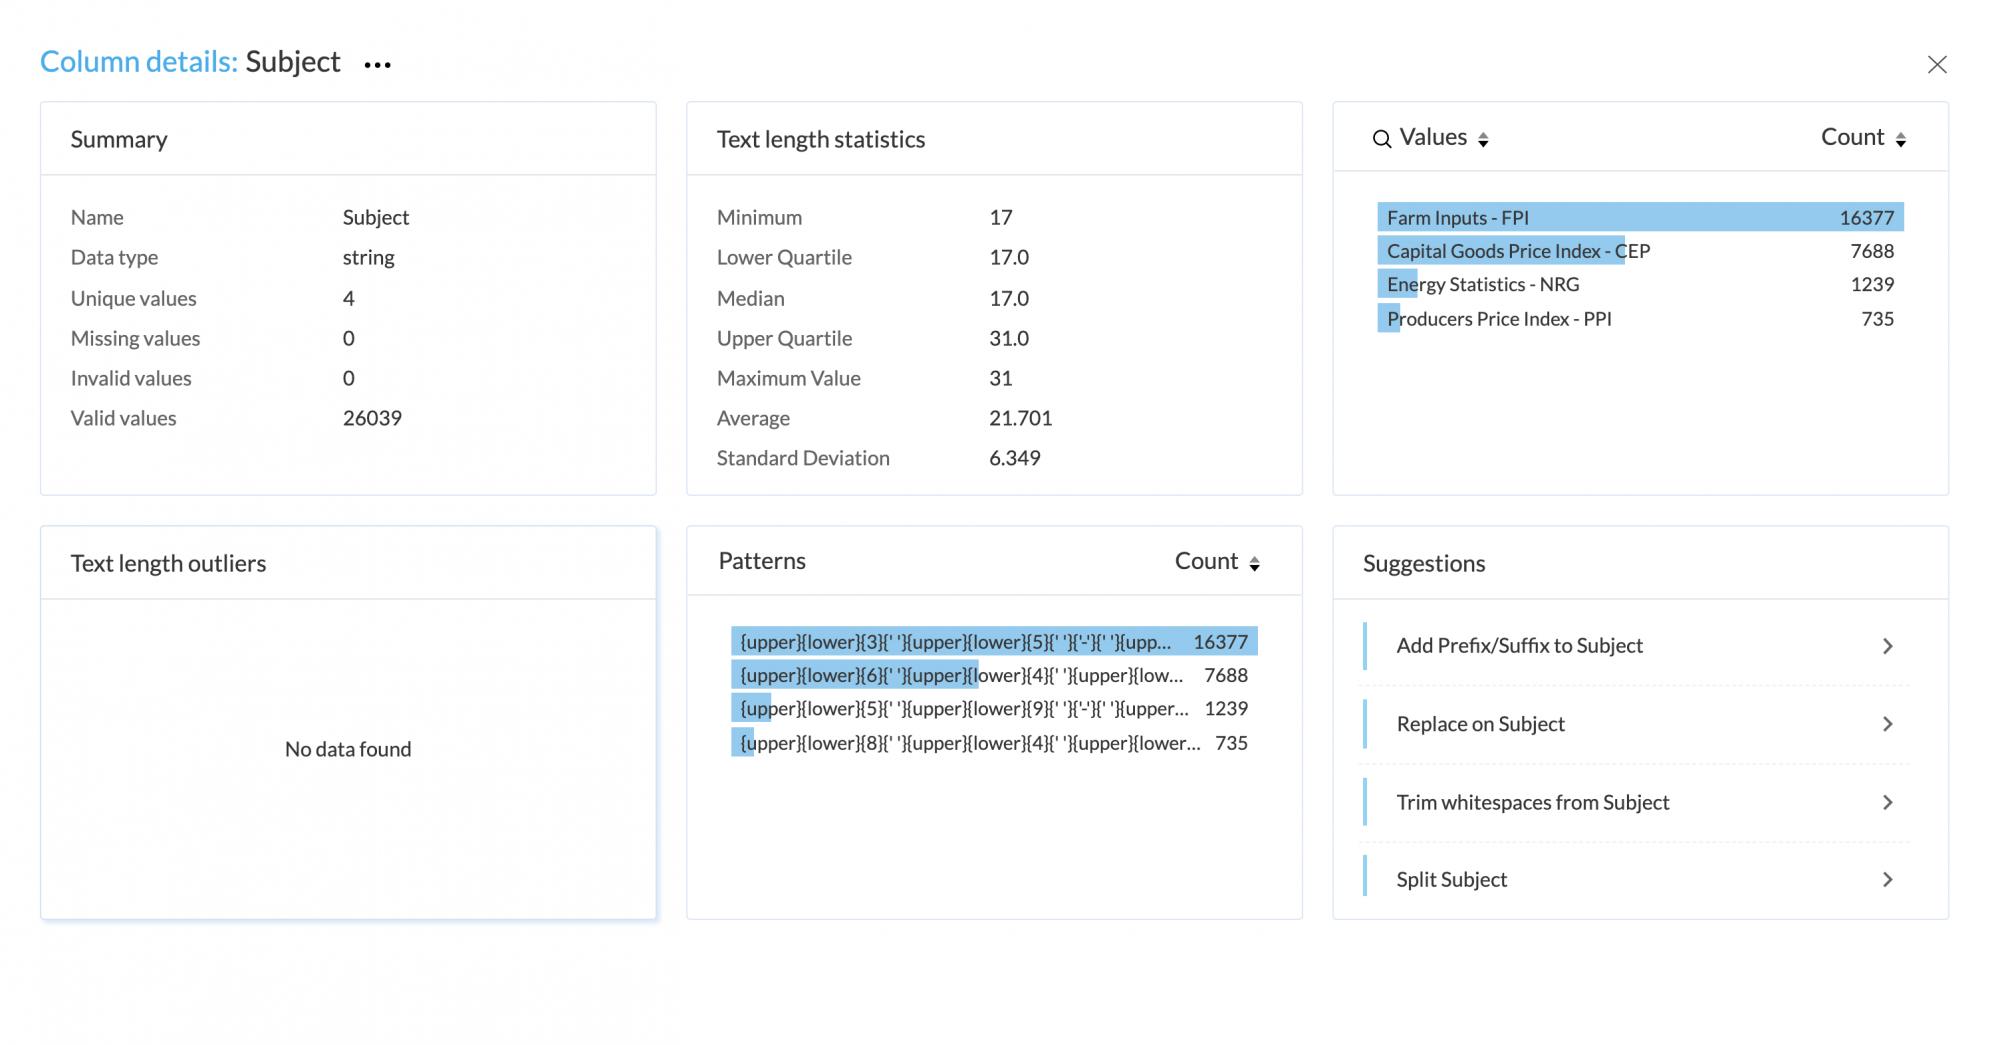
Expanded column details
The Expanded column details section contains further details on the column data including auto-identified data patterns and outliers.
The following widgets are available under the expanded column details view:
- Summary - consists of a detailed summary on the column data.
- Statistics - consists of statistical data points on the column data
- Histogram - consists of distinct values or the range of data depending on the data type of the column
- Outliers - consists of text length outliers or pattern outliers depending on the data type.
- Column data quality - consists of the data quality chart with options to filter valid, invalid and missing values in the column.
- Patterns - consists of auto-identified data patterns from the column data
- Suggestions - consists of intelligent suggestions to increase the data quality of the column selected.
Search & filter
Perform search operations and apply filters to the dataset using the Search & filter box. You can use the suggestions that appear as you type for faster results.
You can also select default filters with predefined conditions using the filter icon from the Search & filter box.
- When you add a filter, a chip appears next to the search box. You can select the chip and edit the search keyword and associated conditions any time.
- The conditions available in the filter are:
- Contains (default option)
- Doesn't contain
- Begins with
- Doesn't begin with
- Ends with
- Doesn't end with
- Is
- Is not
- When you add more filters, each filter will be added as a chip.
- To remove a filter, click on the close button on the chip.
- To remove all filters, click on the Clear all button to the right of the last chip.
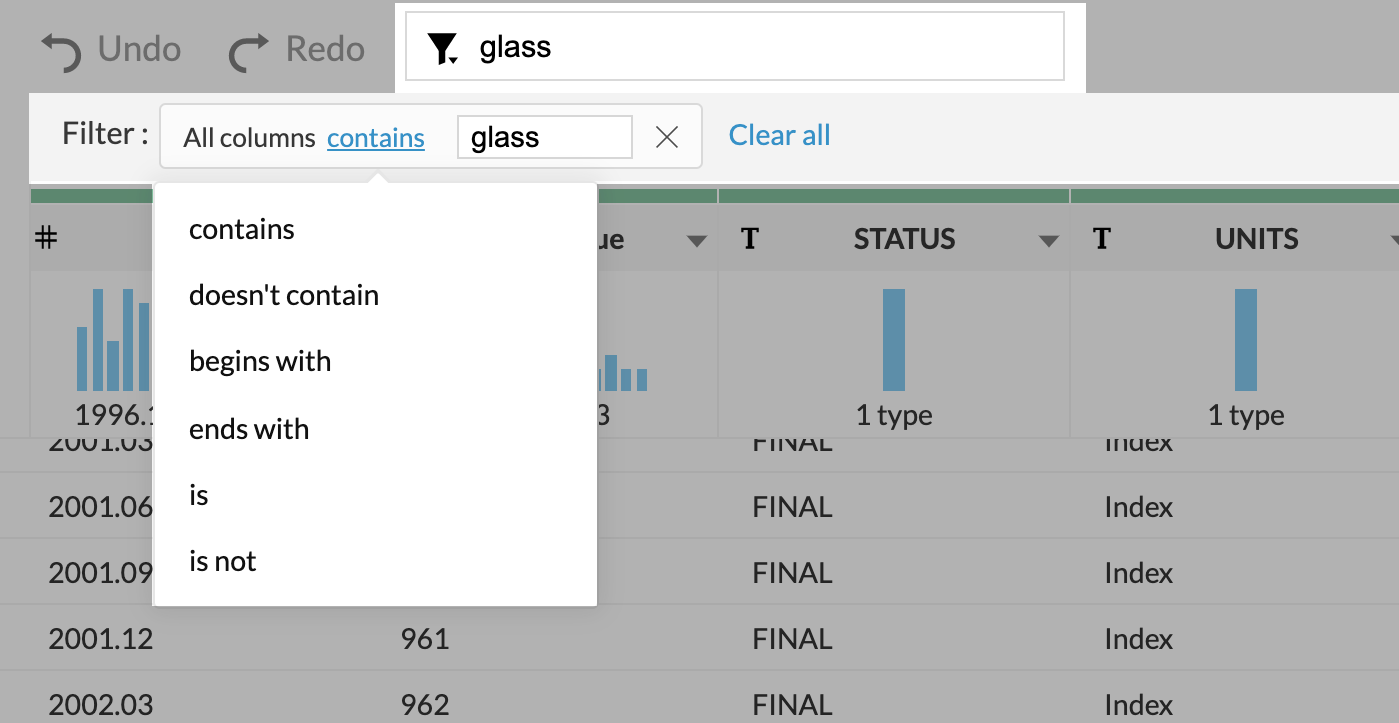
Undo and Redo
The Undo and Redo buttons are located to the left of the search box. You can use these options to undo the previous transforms that were applied, edited, disabled, or deleted, or redo the previous operations once more.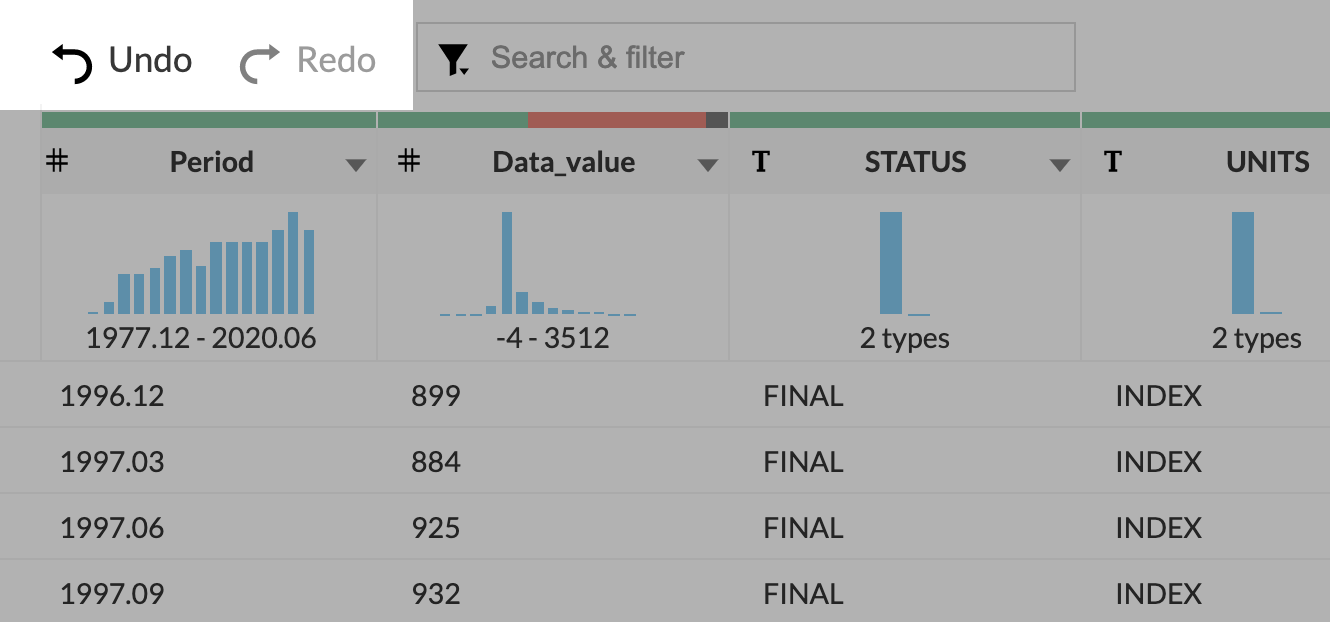
Performing transformations
In the DataPrep pane, you can right-click on any column to get the list of transforms available. You can then click on one of the transforms and provide inputs to apply and make necessary changes to the column. DataPrep shows a live preview of the column during the transformation.
You can also apply the same transformation on multiple columns by selecting more columns in the Columns to apply section. Each transformation is recorded as a rule in the Ruleset area. ![]()
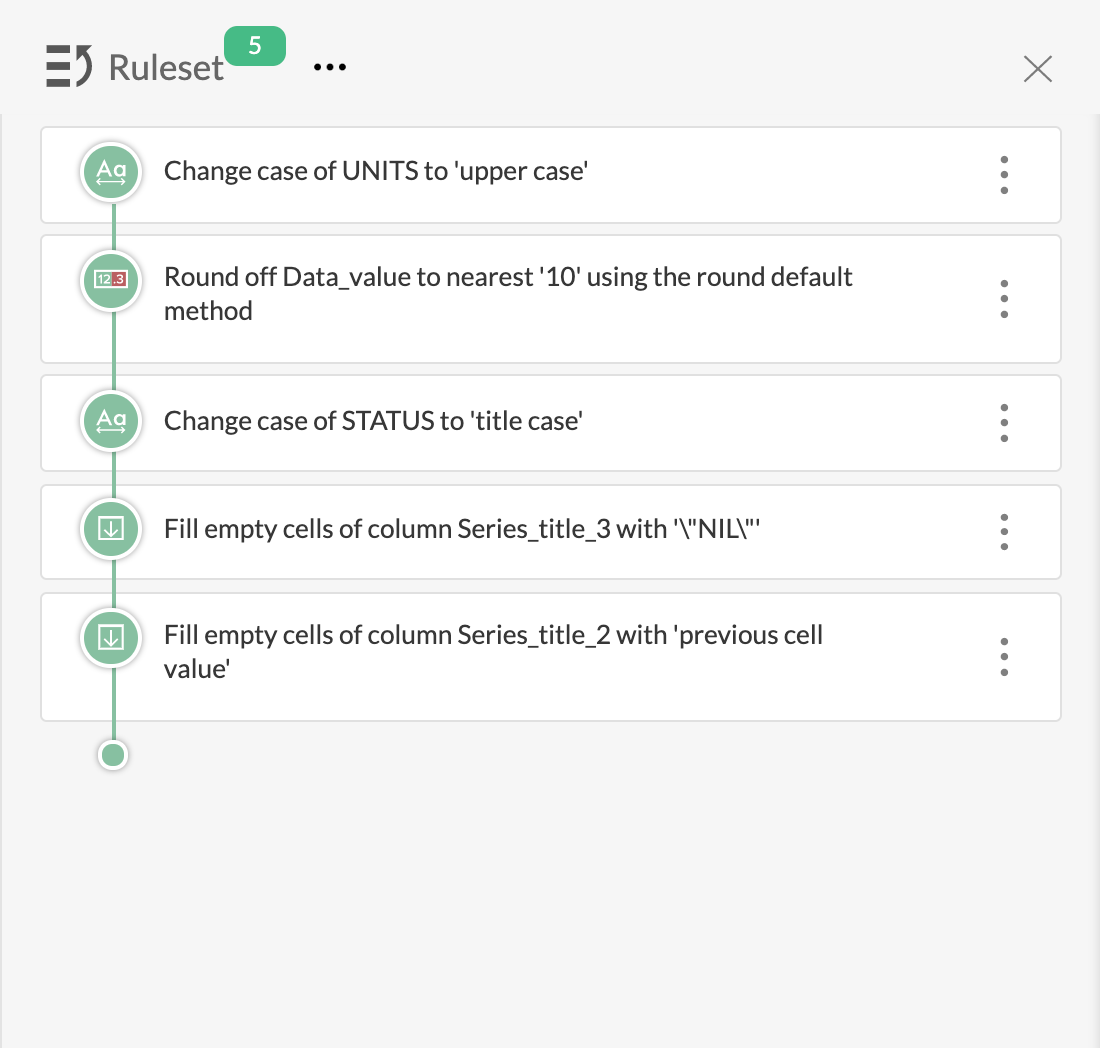
Ruleset
Each transformation applied on the dataset is stored as a rule, in order of their execution. The ordered list of these rules is called a Ruleset. You can access the Ruleset from the Ruleset pane, where you can add, edit, preview, or remove the rules that have been applied.
To access the Ruleset:
- Click the Ruleset icon in the top-right corner of the Operations page to view the Ruleset pane.
- The Ruleset pane will slide open into view. You can see the data source of your dataset added by default to the top of your Ruleset.
- If you select a rule before the latest (last) one in your Ruleset, the data grid is updated to reflect the state of the data at that time. You can edit this transformation applied in the rule using the Operations bar.
- When you are in a previous state of the sample, all subsequent rules will be grayed out in the Ruleset pane.
- If you apply for a new transformation in a previous state, the new rule will be added after the current selection.
- At this point, all rules after the new rule will be recomputed for transformation and rules with errors will be highlighted in red.
- For example, if you delete the column "first_name" in the new rule when the column is being used in the following rule, it cannot be executed and will be highlighted in red so you can address the issue.
Ruleset operations
Using the Ruleset operations, you can search for a rule in the Ruleset, or view the edit history. Let's look at each of these options:
- Ruleset history
- Search
Ruleset history - Click Ruleset history from the <horizontal hamburger menu> to view the changes in Ruleset's timeline. Ruleset history include the user information who created/modified the rules, the timestamp when the changes were made, and the various operations added to the Ruleset.
Search - Choose Search from the <horizontal hamburger `menu> icon to perform a search in your Ruleset. For example, you can search the column name to find all the rules applied in that column.
Options with individual rules
You can modify individual rules using the actions associated with them. Click the <vertical hamburger dots> menu on the rules to Edit, Disable, or Remove the rule. You can also use the Insert rule before option to insert a rule prior to your current selection. The option Show info is used to retrieve the rule information.
Edit - Click Edit when you want to edit the transformation applied with the rule. You can make changes to the transformation in the Operations bar and verify the output in the preview. Click Apply to save your changes. The transformation will be recomputed to reflect the changes.
Remove - Click Remove when you want to delete a rule from the Ruleset. This will remove the rule and recompute transformations on data for the rules left.
Note: You can always undo deletion in case you deleted a rule in error. The Undo button is situated at the top-left just above the data grid.
Disable - Use this option to disable a rule in your Ruleset. This will disable the rule and recompute transformations on data for the rules left. You can always Enable back the rule from the <3 vertical dots> menu.
Insert rule before - Use the Insert rule before option to include a previous step before a rule. When you click, you will see an empty placeholder. Once you apply a transformation, the rule of this transformation will be stored in the placeholder.
Show info - Click on the Show info option for information about a specific rule such as who created or modified the rules. It also includes other details such as, when was the rule created or modified, and the list of users who made the changes.
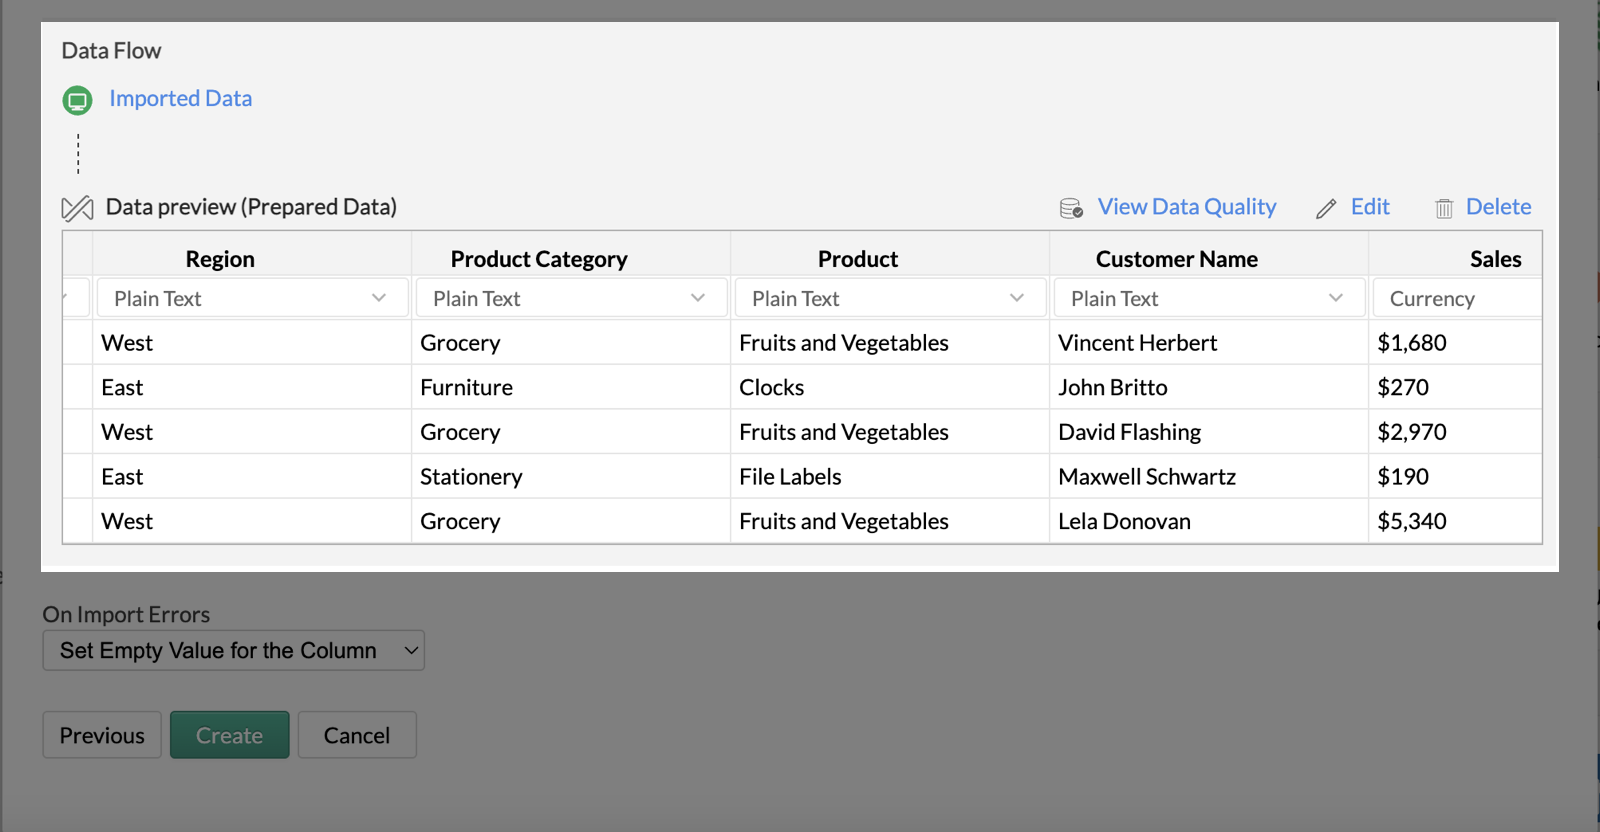
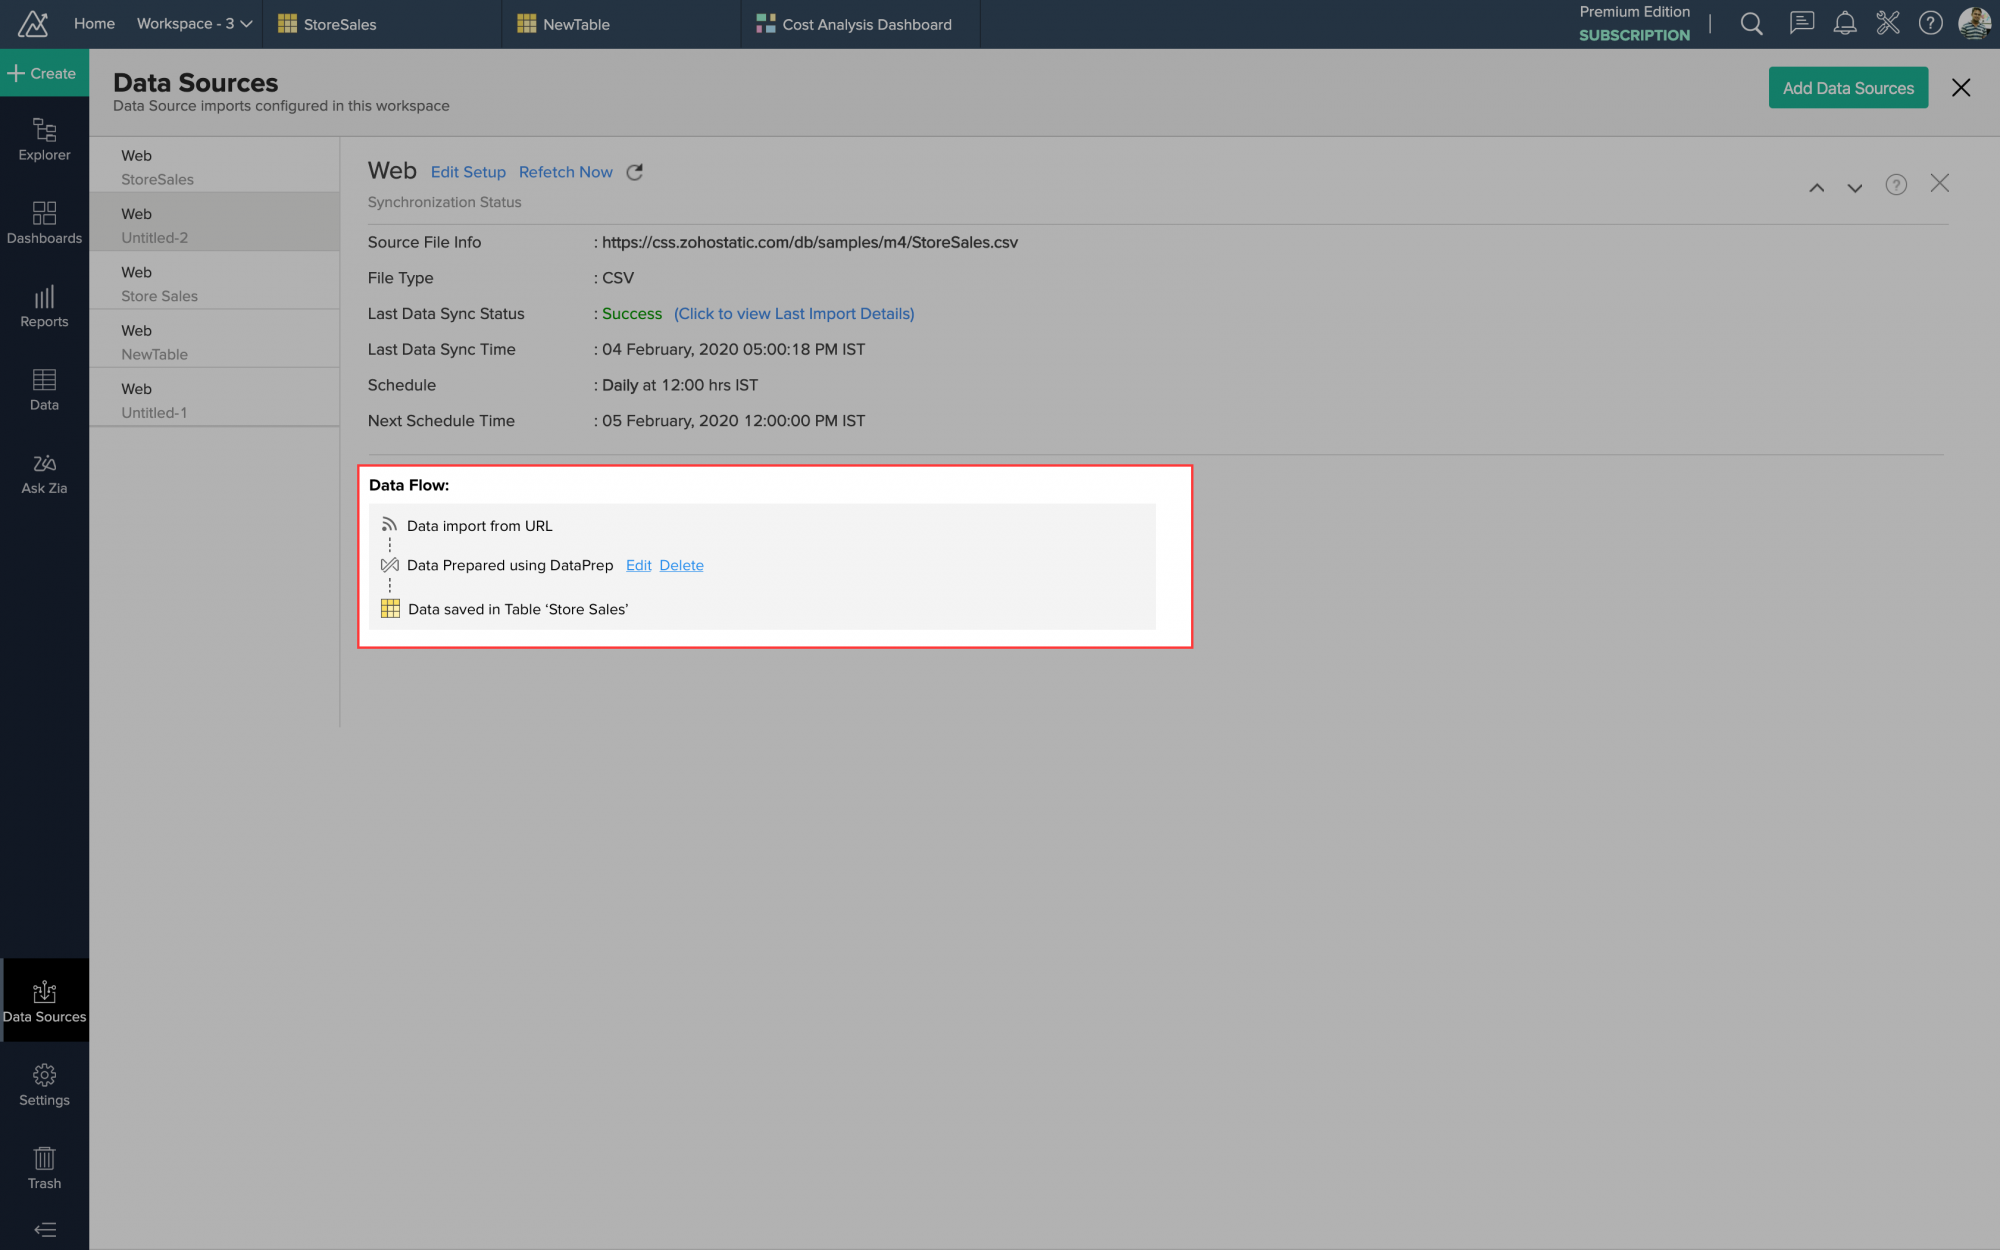
Data flow
Data flow helps you to know at which stage the data has been cleansed and prepared for analytics. You can also Edit or Delete the transformations if necessary.
You can view the Data flow:
- In the Create Table (import) pane
- From the Data Sources page


Edit
Clicking the Edit option will take you to the DataPrep pane where you can make further changes to your data and apply those changes.
Delete
Clicking the Delete option removes the data preparation flow from the next scheduled import, and the originally imported data is retained.
Undo prepared data
Undo prepared data option allows you to undo all the transformations applied over the imported data. This is particularly useful if you made a mistake and wish to undo all the changes made to your data using DataPrep.
After applying changes to the table, the undo prepared data option will be enabled. Using this option you can undo all the changes performed in the previous prepare data session.
The Undo prepared data option will only revert the last data preparation session, but none of the prepared data sessions before that. Undoing prepared data is permanent. Only further data preparation is possible from this point.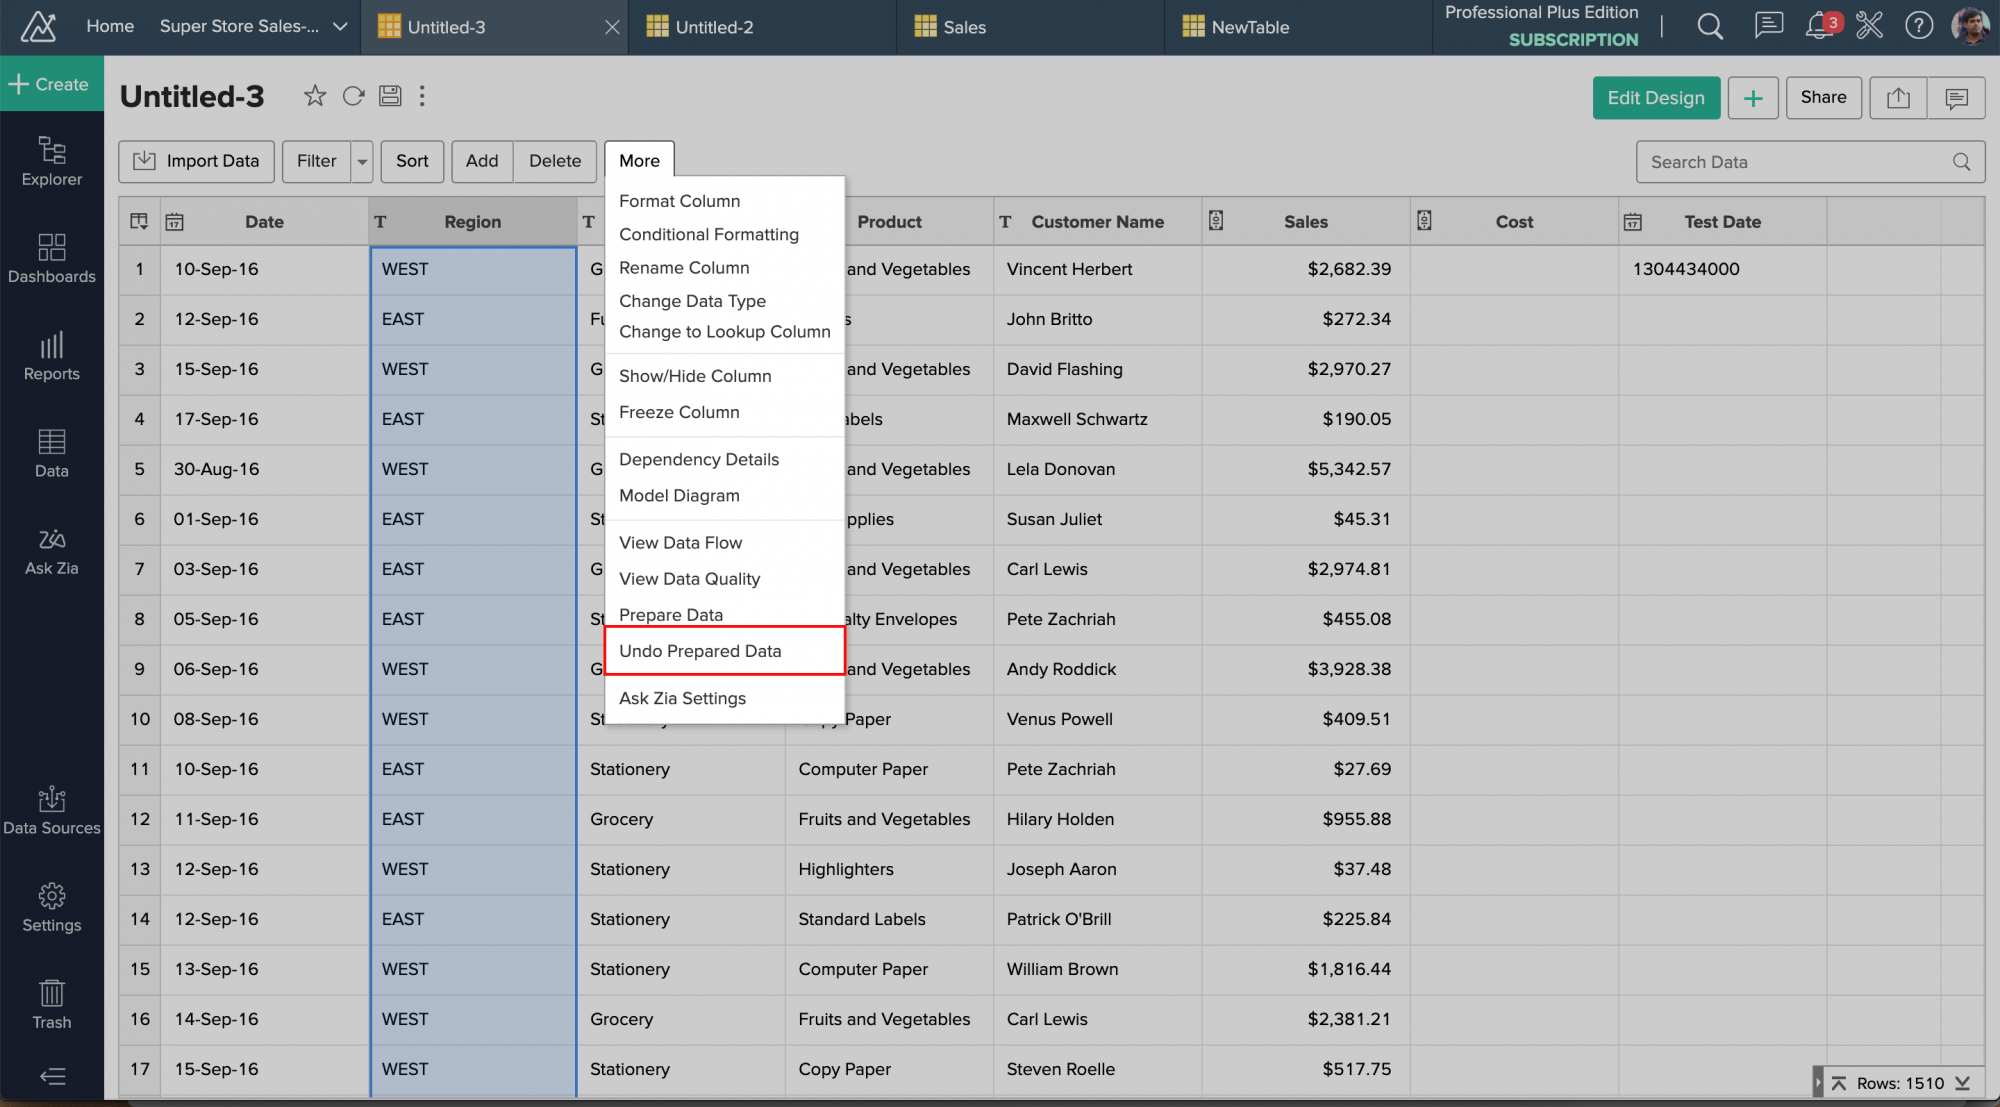
DataPrep standalone versus DataPrep add-on
There are some differences in the availability of transforms between Zoho DataPrep add-on and the standalone solution while during and after the data import. The differences are explained in the table below:
| Features | DataPrep | DataPrep Add-on | |
| During Import | After import | ||
| Dataset Transforms | |||
| Deduplicate | Yes | Yes | Yes |
| Join | Yes | No | No |
| Append | Yes | No | No |
| Pivot | Yes | No | No |
| UnPivot | Yes | Yes | No |
| Filter | Yes | Yes | Yes |
| Select | Yes | Yes | No |
| Add formula | Yes | Yes | No |
| Window functions | Yes | Yes | No |
| Derive dataset | Yes | No | No |
| Column Transforms | |||
| Change data type | Yes | Yes | No |
| Replace | Yes | Yes | Yes |
| Split | Yes | Yes | No |
| Merge | Yes | Yes | No |
| Trim spaces | Yes | Yes | Yes |
| Truncate | Yes | Yes | Yes |
| Add Prefix or Suffix | Yes | Yes | Yes |
| Fill empty cells | Yes | Yes | Yes |
| Count | Yes | Yes | No |
| Extract | Yes | Yes | No |
| Change format | Yes | Yes | No |
| Round off | Yes | Yes | Yes |
| Create buckets | Yes | Yes | No |
| Cluster and Merge | Yes | Yes | Yes |
| Change case | Yes | Yes | Yes |
| Language detection | Yes | Yes | No |
| Keyword extraction | Yes | Yes | No |
| Sentiment analysis | Yes | Yes | No |
| Change date format | Yes | Yes | No |
| Unify date formats | Yes | Yes | No |
| Extract from Map | Yes | Yes | Not applicable |
| Extract from List | Yes | Yes | Not applicable |
| Sort Column | Yes | Yes | Yes |
| Rename Column | Yes | Yes | No |
| Delete Column | Yes | Yes | No |
| Move Column | Yes | Yes | No |
| Smart Selection | Yes | Yes | No |
To learn more about transforms in the standalone product, visit the link.
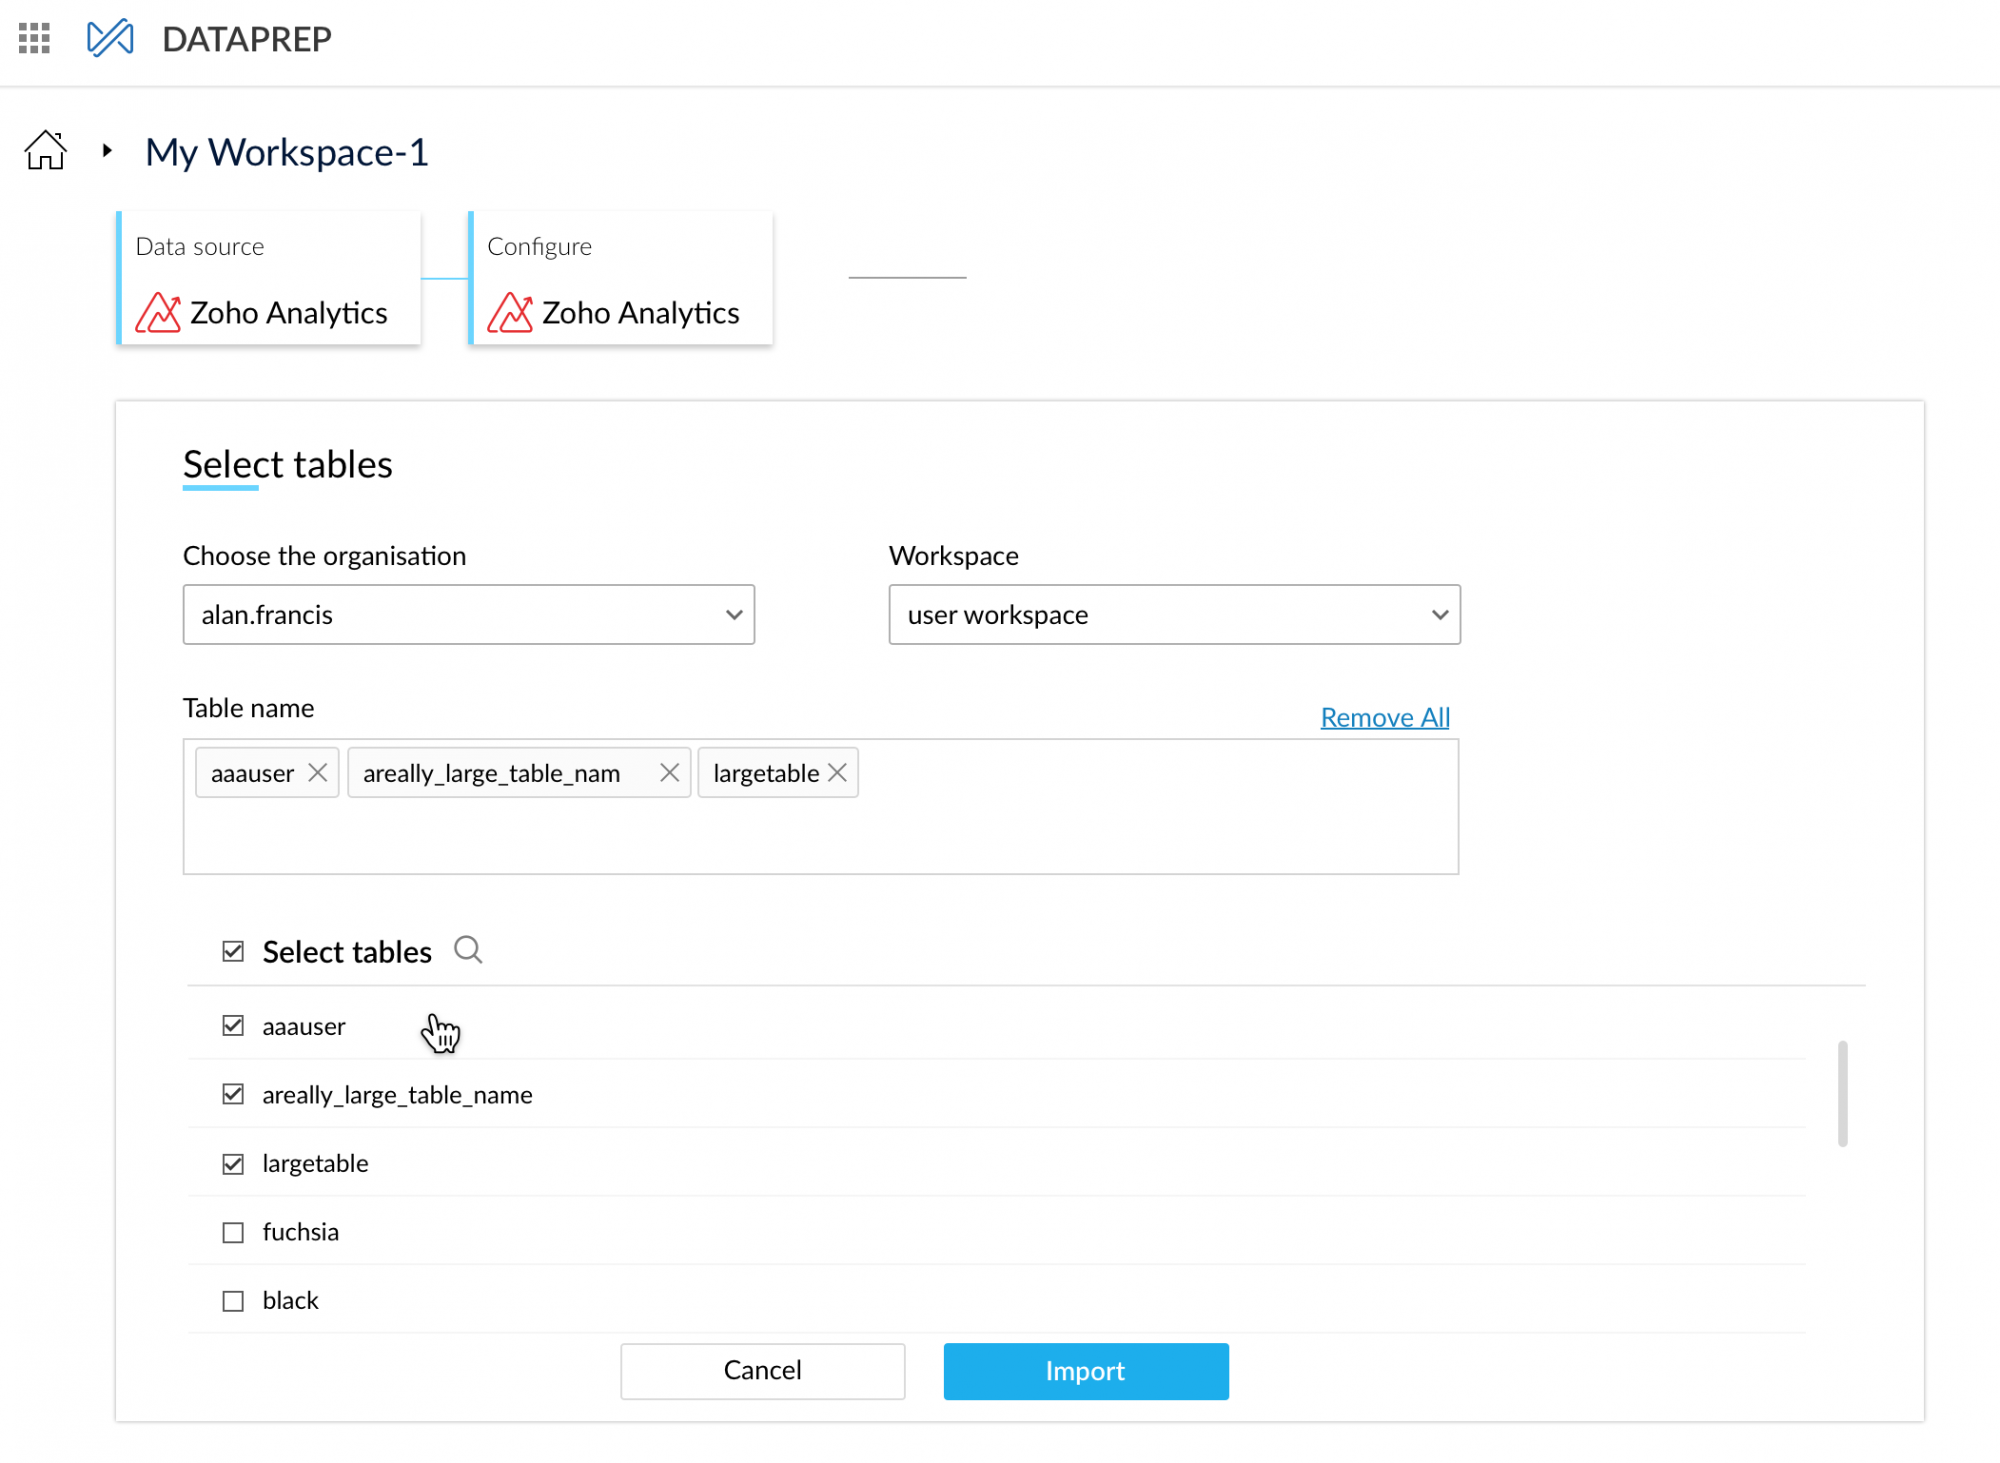
Import Data from Zoho Analytics into DataPrep
In the standalone Zoho DataPrep application, you can import data from Zoho Analytics into DataPrep seamlessly using the Analytics connector for Zoho DataPrep. With the connector you can set up data imports and configure import schedules from Analytics as shown in the screenshot below. You can learn more about importing data using the Zoho Analytics connector from here.
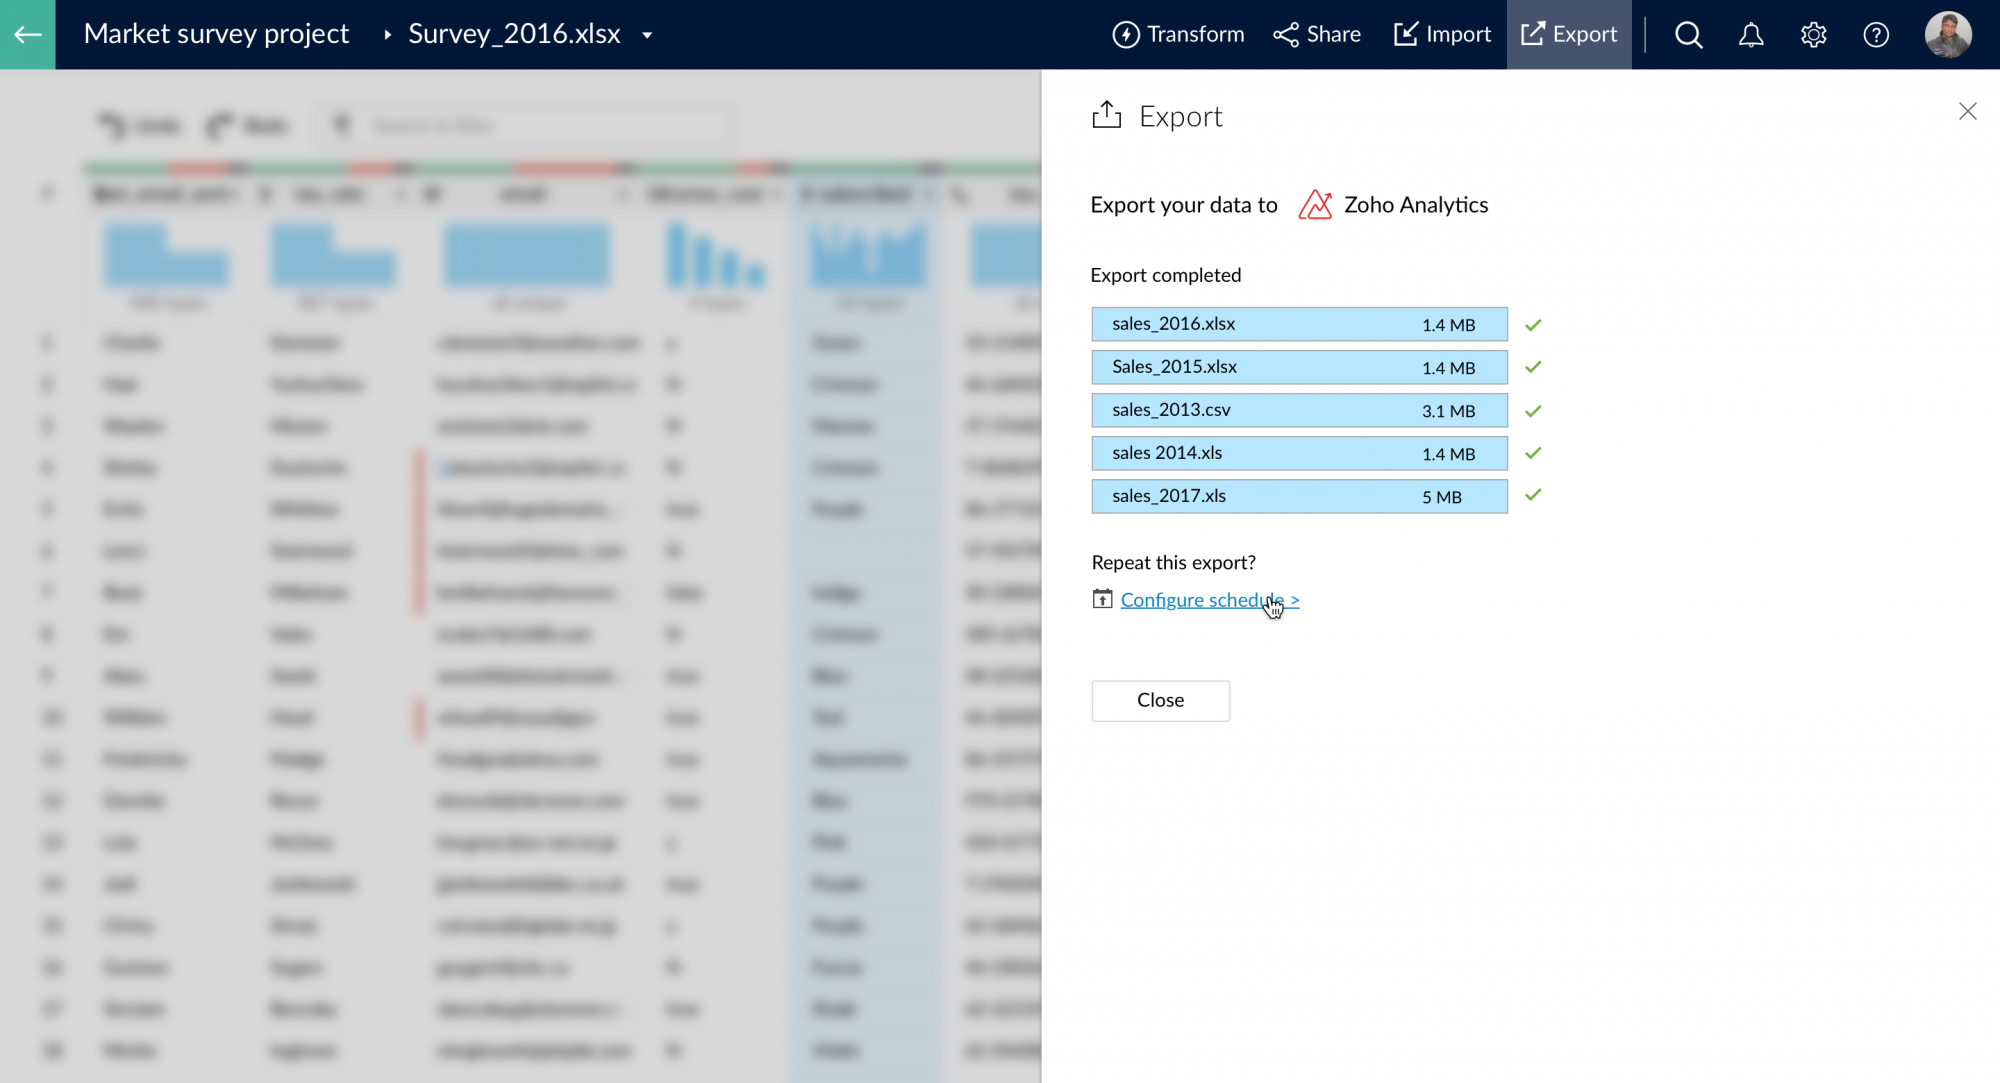
Export Data from Zoho DataPrep into Zoho Analytics
In the standalone Zoho DataPrep application, you can export prepared data to Zoho Analytics seamlessly using the Analytics connector for Zoho DataPrep. With the connector you can set up data exports and configure export schedules to Zoho Analytics as shown in the screenshot below. You can learn more about exporting data using the Zoho Analytics connector from here.
Troubleshooting
1. How to correct errors made during the data preparation process in a table?
You can correct the errors by clicking on More and then the Undo prepared data option from the table. This will revert all the changes done in the previous data preparation session
2. How to fix quality data issues while importing data?
You can fix data quality issues by using the various transforms like deduplicate, find and replace, truncate, change format, fill empty cells, unify date format, change datatype, etc.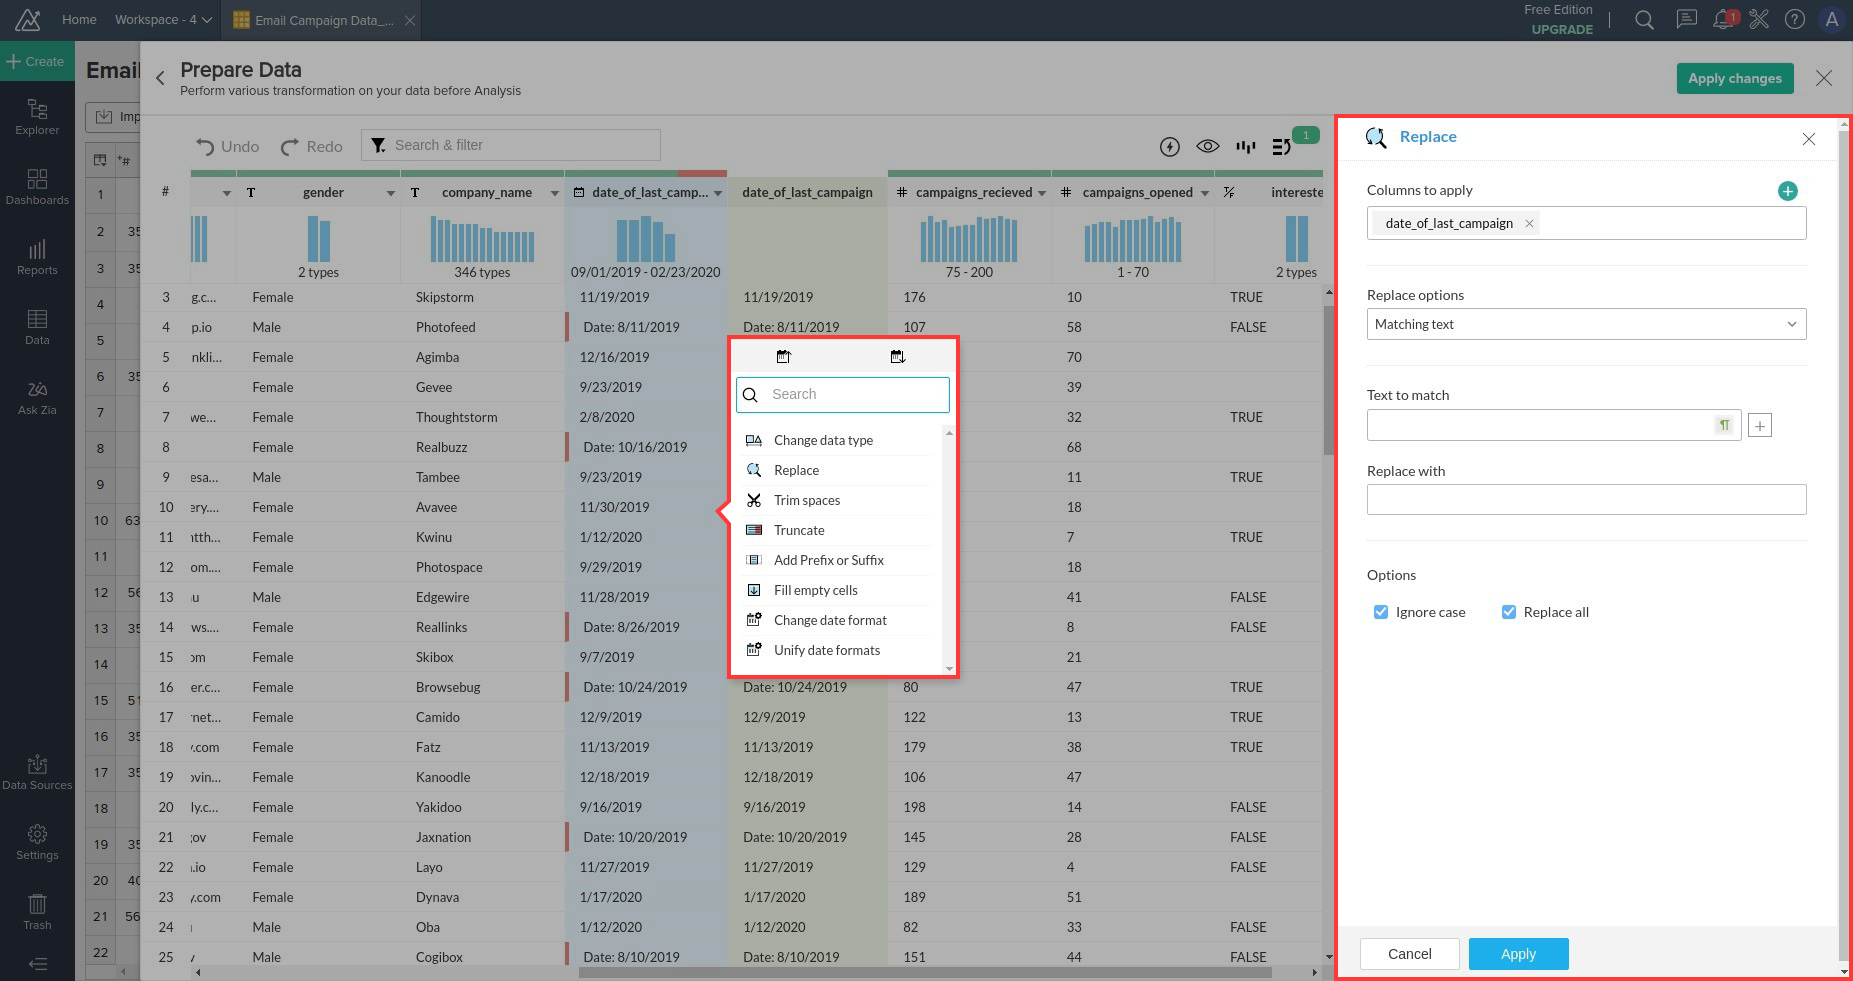
3. The data preparation options are limited for a table in Zoho Analytics. How can I take full advantage of all Zoho DataPrep features?
To use the full power of Zoho DataPrep, import the data from Zoho Analytics into Zoho DataPrep, cleanse the data and then export it back into Zoho Analytics onto another table.
4. What will happen if I see a problem in the data during import schedule?
In this case, you will have to re-import the data from the source and reapply the transforms based on the data.
5. How to setup a perfect data ingest flow using Zoho DataPrep?
The ideal flow is where dataprep is used to ingest data after which the data is pushed to Zoho Analytics using the Export to Zoho Analytics option.
6. How to push data into an existing table from Zoho Dataprep?
You cannot push data into an existing table presently. However, this feature is being worked on and will be available soon.
Solutions
Extracting Data from JSON Columns
You may have a file that contains few columns in JSON format. You can extract data from such columns easily using Zoho DataPrep.