Creating a Tabular View
A Tabular View as the name implies is a simple table-like report, that can be created with an intuitive drag and drop interface, over your data tables. With Tabular View, you can easily summarize, structure, group, filter, and customize data the way you want.
In this section, we will see how to create a Tabular View:
- Creating a Tabular View
- Applying Summary Functions on Columns
- Applying Filters
- Providing User Filters
- Adding Formula
Creating a Tabular View
You can create a Tabular View in Zoho Analytics by following the below steps:
- Open the workspace containing the data tables on which you want to create a Tabular View.
- Click Create > Tabular View.
- In the Select Base Table dialog box, choose the data table on which you want to create the Tabular View and click OK. Alternatively, you can also create a new Tabular View by opening the corresponding data table and clicking the New > New Tabular View option in the toolbar.
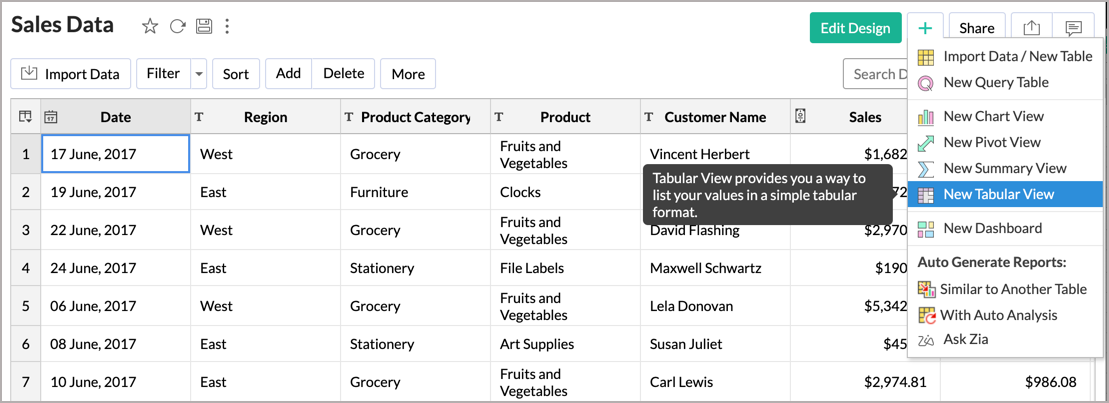
- In the Tabular View Edit Design page that opens, drag and drop the columns from the Column List pane on the left to the corresponding shelves in the Design Area on the right.
You can also select the checkbox adjacent to each column to auto-place the columns into the appropriate shelves. - Click Click Here to Generate Report.
- Once you have added the required data, click the Save button in the toolbar. In the Save As dialog box that appears, type a Name and Description for the tabular view and choose the folder where the view is to be saved.
- Click OK.

A tabular view will be created and saved in your workspace. You can customize the look and feel of your tabular view using the various customization options available. Learn more.
About Shelves
The following is a brief description of each shelf in the Design Area of the Tabular View.
Columns: Data from the columns dropped in this shelf will be added as columns in the Tabular View. You can drop any number of columns in this shelf.
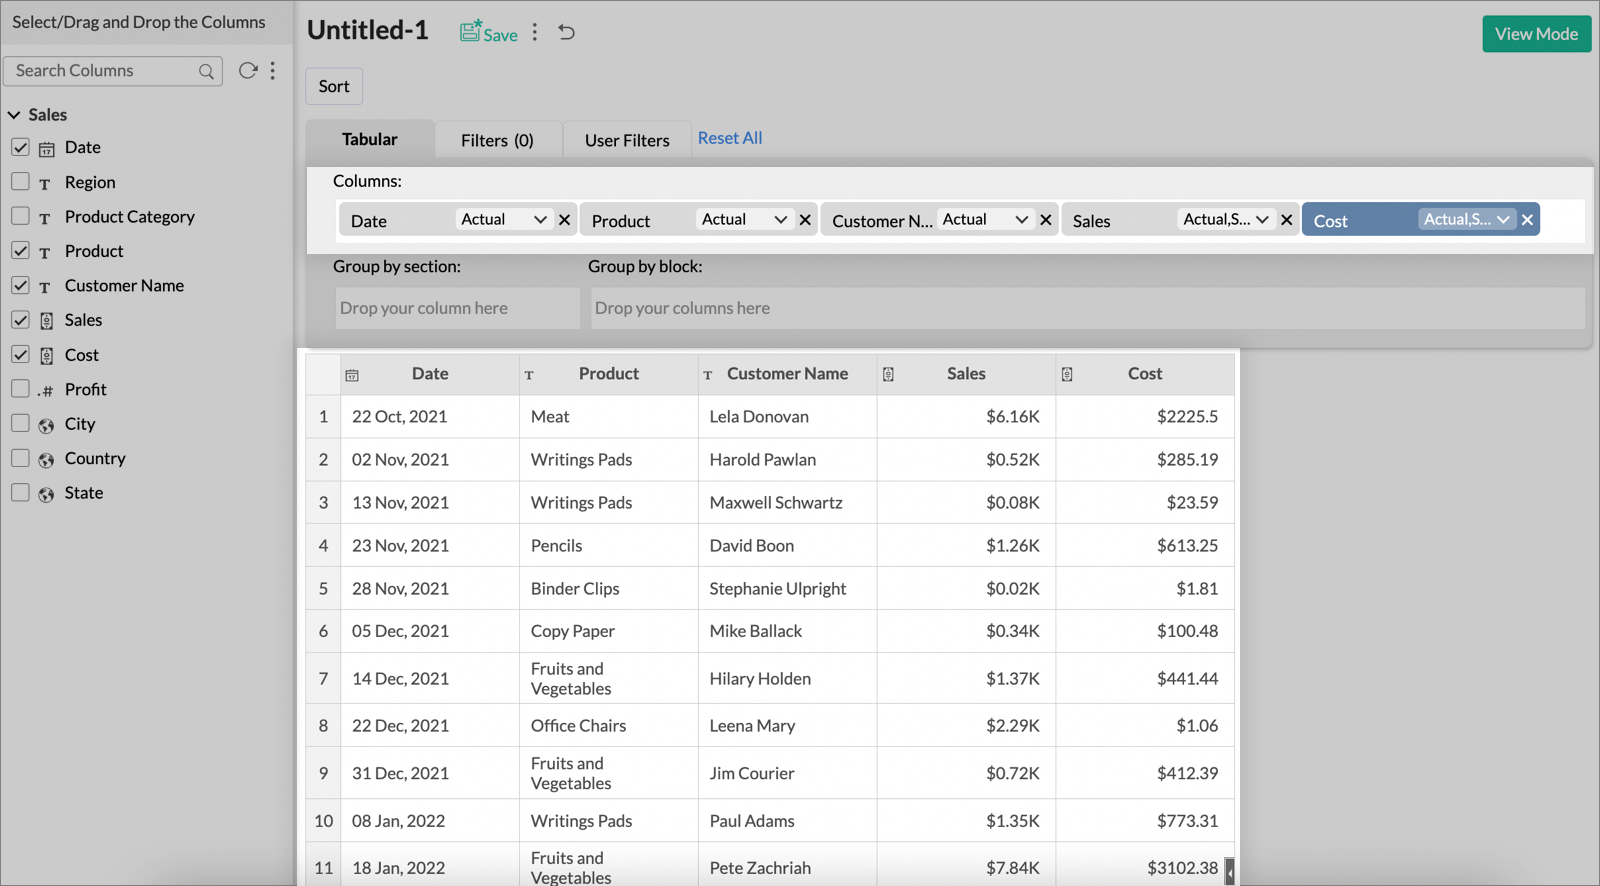
Group by section: Columns dropped in this shelf will be used to group the Tabular View into sections. You can only have one sectional grouping in a Tabular View.

Group by block: Columns dropped in this shelf will group your Tabular View data rows into blocks. When you add multiple columns, they will be displayed as categorized layers (a group within a group) of data horizontally.

We will understand about Tabular View shelves using an example. Let's look at how to create a Tabular View with groups and summaries from a Sales data table like the one shown below.

We will create a Tabular View to analyze the Sales and Cost of products sold based on Date and Customer Name. To do this, we will add the following data columns from the Sales Details table into Columns shelf with the corresponding function selected,
| Column Name | Function |
| Date | Actual |
| Customer Name | Actual |
| Product | Actual |
| Sales | Actual, Sum |
| Cost | Actual, Sum |
The generated Tabular View will be displayed as below.

We will add further details to this table by grouping them into sections based on Product Category and blocks based on Region. To do this, add Product Category to the Group by section shelf and Region to the Group by block shelf and click the Click Here to Generate Report button.

Once you are satisfied with the generated Tabular View, provide a Name and Save the changes made. The final table will be as displayed below.

You have successfully created a Tabular View in Zoho Analytics. You can further add Filters, User Filters, and customize the created tabular view as required.
Applying Summary Functions on Columns
Zoho Analytics enables you to apply one or more summary functions to the columns in the Tabular View. When you apply a summary function over a column, a summary row for each group (block and section) and a grand summary row for the view will be displayed. Listed below are the sets of summary functions supported by Zoho Analytics for a tabular view and their functionalities.
| Numeric and Currency Data Type | |
| Function | Description |
| Sum | Returns the sum of all the values in the column. If the columns are grouped, summation will be applied at the group level. |
| Average | Returns arithmetic mean of all the values in the column. In case grouping has been applied, it will return the average value at the group level. |
| Count Records | Returns a count of the number of records in the column. If grouping is applied, it then provides the total number of records at the group level. |
| Min | Returns minimum value in the column. If the columns are grouped, then the minimum value will be applied at the group level. |
| Max | Returns maximum value in the column. If the columns are grouped, then the maximum value will be applied at group level. |
| Standard Deviation | Returns the standard deviation of the column. If the columns are grouped, then it will then display the standard deviation at the group level. |
| Variance | Returns the variance of the column. If the columns are grouped, then the function will be applied at the group level. |
| String Data Type | |
| Count Records | Returns the count of the number of records in the column. If grouping is applied, it then provides the total number of records at the group level. |
To apply summary functions:
- Drag and drop the required columns into the Columns/Group by block shelf.
- Click the Function drop-down from the dropped column and click the Show Summary option.
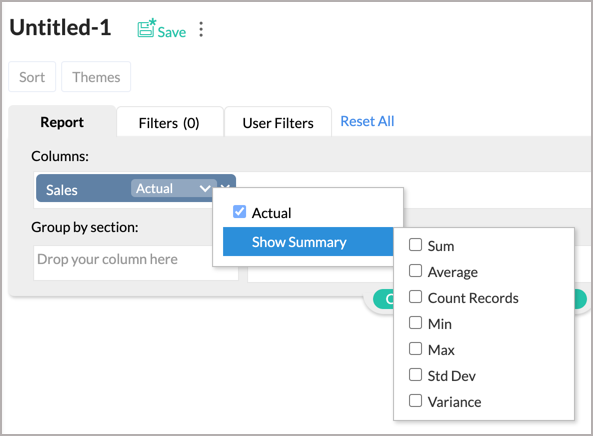
You can choose from the displayed list of possible summary functions. You can also choose to apply multiple summary functions.
Note: You can apply summary functions only over the columns dropped in Columns and Group by block shelf.- Click the Click here to Generate Report link, after selecting the required summary function, to generate the report.
The following Tabular View shows the sum and average value of sales and cost of each product grouped based on its region.

Applying Filters
Zoho Analytics allows you to filter a column for specific ranges, individual values, date ranges, and more, depending on the data type of the column. You can also apply multiple filters (based on multiple columns) in a Tabular View.
Here, we will filter the created Sales Overview Tabular View to display only the data for 2019, 2020, and 2021. To do this:
- Click the Edit Design option in the toolbar.
- Click the Filters tab next to the Report tab in the Design Area.

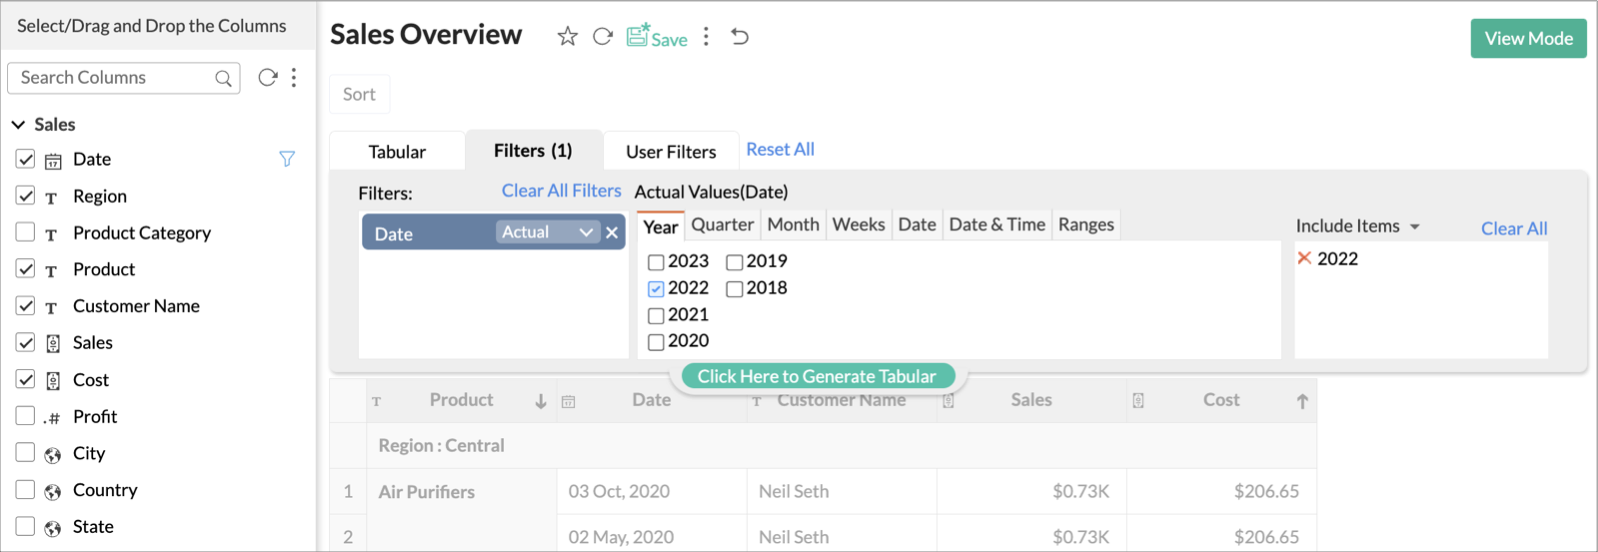
- Drag and drop the Date column from the Column List pane on the left into the Filters shelf. Once a column is dropped, a list of all the possible options available for filtering the data will be displayed in the box next to the Filters shelf as shown in the screenshot below.
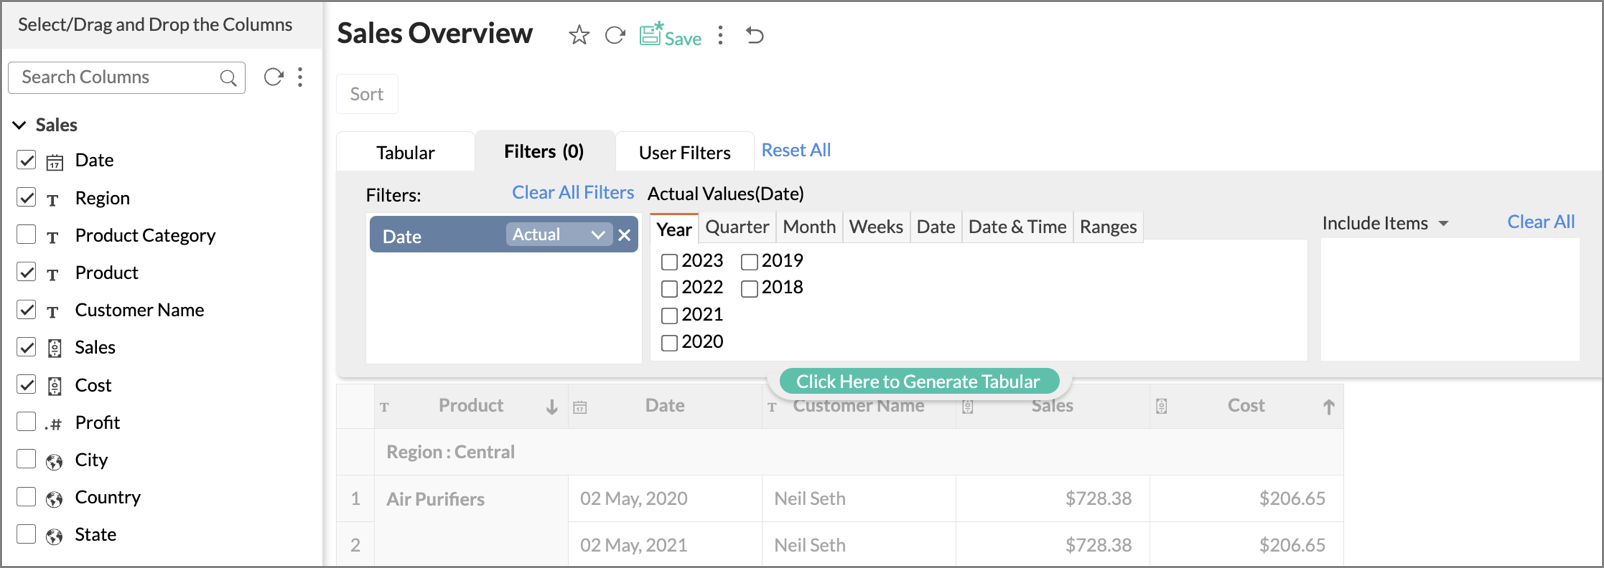
- Filtering options vary depending on the data type of the dropped column. After you have dropped the column, select one or more values to filter by. Here, we will filter to display data pertaining to the year 2022 alone. The selected filter items will appear in the third box on the right.
- Click the Click Here to Generate Report button.
As shown in the below screenshot, data that matches the applied filter will be displayed. You can view the generated Tabular View by navigating to the View Mode.

When dropping a column as a filter, it will list a set of possible options that can be used as filters. The filtering options provided will vary, based on the data type of the column dropped. The following section provides all the possible filtering options for columns with data types like Text, Numeric and Currency, and Date.
Data Type - Text
The text type column can be filtered using the following options.
This allows you to filter the chart by Actual value. All the distinct values from the column will be listed with a checkbox. Select the value to include or exclude from the chart. You can select multiple values too. A Search box is also available to find the required values.
Wildcard filter allows you to filter by specifying filter criteria. The following table lists the possible conditions for filtering.
| Option | Description |
| Exactly Matches | Filters all the values that exactly match the search term. |
| Does Not Match | Filters all the values that do not match the search term. |
| Contain | Filters all the values that contain the search term. |
| Does Not Contain | Filters all the values that do not contain the search term. |
| Start With | Filters all the values that start with the search term. |
| Does Not Start With | Filters all the values that do not start with the search term. |
| End With | Filters all the values that end with the search term. |
| Does Not End With | Filters all the values that do not end with the search term. |
You can construct filter criteria with multiple conditions and join the condition using (AND) or (OR) operator. You can specify the join operator by clicking the link adjacent to the conditions.

By default, conditions from last to first will be grouped. i.e., when you have three conditions, the third and the second will be joined, and the result will then be joined with the first. You can change the default grouping of the conditions if needed. To modify, click the Edit link next to the Criteria Expression. Modify the filter criteria as required, and then click OK.
The search terms are not case-sensitive.
You can specify up to 15 conditions for filtering data.
Data Type - Numeric and Currency
This allows you to filter the columns with Numeric and Currency data types. The filtering options like individual values and ranges are available.
| Option | Description |
| Individual Values | This option allows you to filter data based on individual values of the selected numeric column. All possible individual values of the dropped column will be listed in the filter tab. You can select these values to filter them. |
| Ranges | This option allows you to filter data based on numeric ranges into which the values in the columns can be segmented e.g., 0 to 100, 101 to 250 etc., Filter tab will list a suggested range of values for filtering. You can choose the required range to filter. You can also add your own custom ranges for filtering. |

Zoho Analytics allows you to define your own custom ranges, if the listed values do not meet your needs. You can add your custom ranges, by clicking the Add New Range button under the corresponding option. 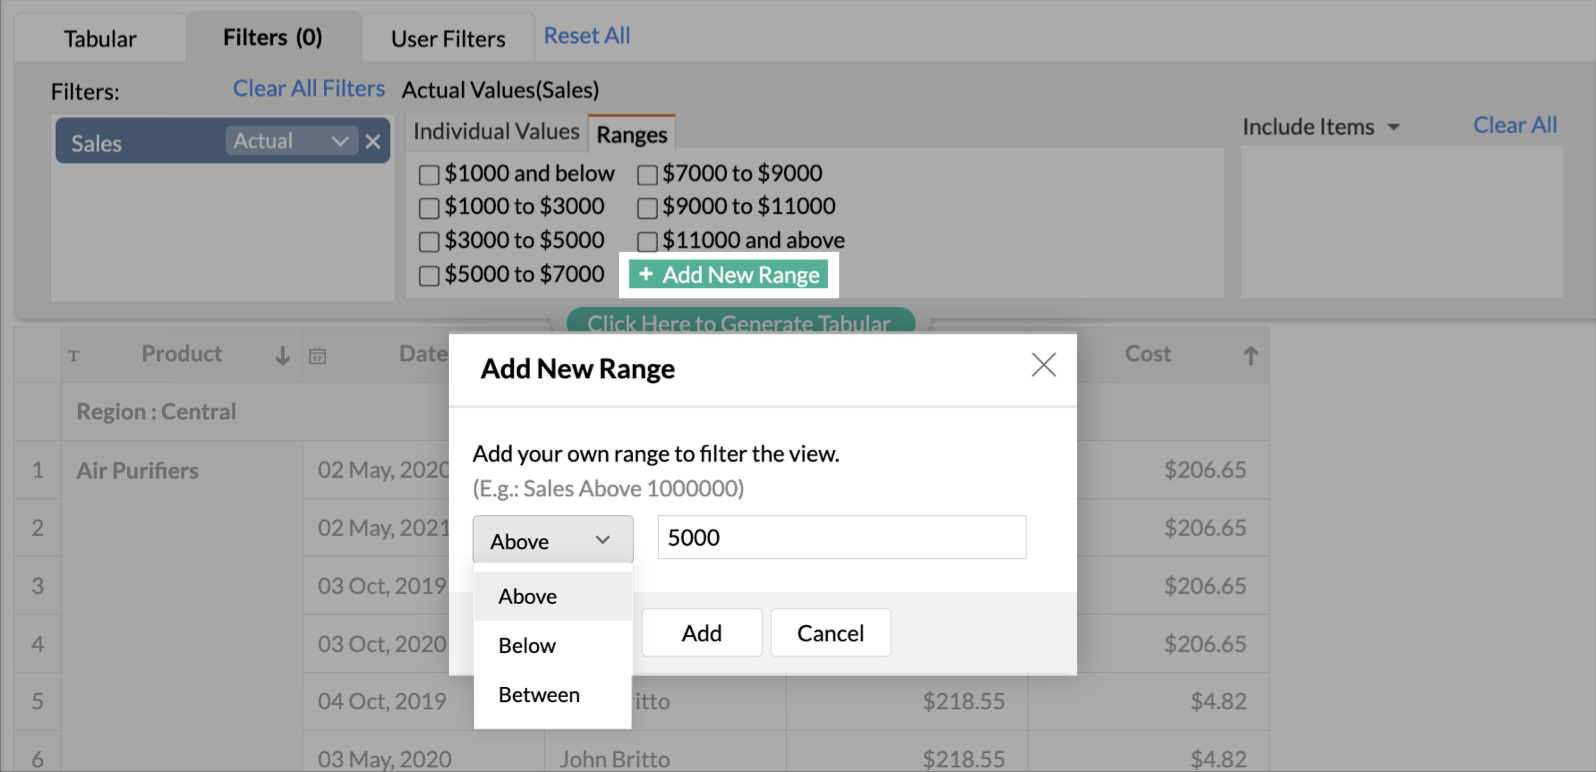
Data Type - Date
When a column has Date data type, the filtering options are grouped under three categories as Actual, Seasonal and Relative filters. You can choose them based on your need.
When you select Actual Values for a Date column, the following options are available for filtering.
| Option | Description |
| Year | Select this option to filter date values based on years |
| Quarter | Select this option to filter date values based on quarters |
| Month | Select this option to filter date values based on months |
| Week | Select this option to filter date values based on weeks |
| Date | Select this option to filter based on date values |
| Date & Time | Select this option to filter based on date & time values |
| Ranges | Select this option to filter values based on date ranges |

To enter a custom date range, under Ranges option click Add New Range. In the Add New Range dialog box that opens, enter dates in the From and To boxes or click the Calender icon to open the calendar to select the required dates and then click Add button.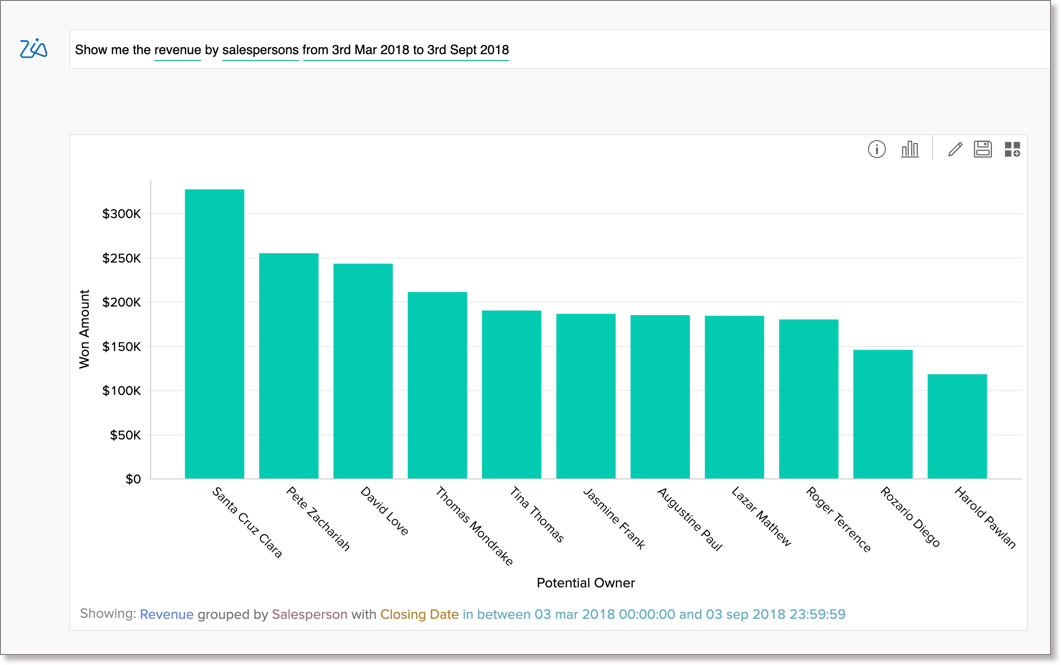
When you select Seasonal filter for a Date column, the following options are available for filtering.
| Option | Description |
| Quarter | Select this option to filter date values based on quarters present across all years in the column. e.g., Q1, Q2. |
| Month | Select this option to filter date values based on months across all years. e.g., January, February. |
| Week | Select this option to filter date values based on weeks across all years. e.g., Week 1, Week 2. |
| Week Day | Select this option to filter date values based on week day across all years. e.g., Sunday, Monday. |
| Day of Month | Select this option to filter date values based on day of month across all dates. e.g., 1 to 31. |
| Hour | Select this option to filter date values based on hours in a day. e.g., 0 to 23hrs |

When you select Relative filter for a Date column, the following options are available for filtering.
| Option | Description |
| Common | Select this option to filter data values based on the common time periods. e.g., Last 1 Hour, Today, This Month etc., |
| Quarter | Select this option to filter data values based on quarters e.g., This Quarter, Last 3 Quarters, Next Quarter etc., |
| Month | Select this option to filter data values based on months e.g., Last Month, Next 6 Months etc., |
| Week | Select this option to filter data values based on week e.g., This Week, Last 3 Weeks etc., |
| Day | Select this option to filter data values based on day e.g., Today, Next 5 Days etc., |
| Hour | Select this option to filter data values based on hour e.g., Last 1 Hour, Last 12 Hours etc., |

Providing User Filters
Zoho Analytics also allows you to include dynamic filters, called User Filters. This enables your users who access the report to apply dynamic filters on the report data using the filter columns exposed as part of the User Filters. The filter columns included in User Filters can be displayed using a variety of display components, such as Drop Down boxes, Slider, and Date range chooser to suit your needs.
In this example, we will add the Product column as a User Filter. To do this,
- Click the Edit Design option in the toolbar.
- Click the User Filters tab next to the Filters tab in the Design Area.
- Drag and drop the Product column into the User Filters shelf.
- Click the Edit icon that appears when hovering on the added user filter.
- In the Choose Component for User Filter dialog that opens:
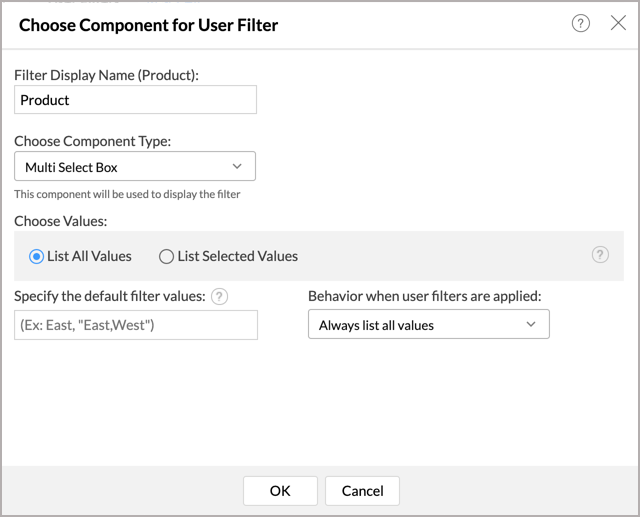
- Provide a Filter Display Name. Here, it is Product.
- Choose Component Type. You can choose Single Select Box to allow the users to filter based on only one value at a time, or the Multi Select Box to allow the users to filter based on multiple values. In this example, we will have a Multi Select Box.
- Choose Values to be displayed. You can choose to list all the values available in the dropped column or select only a few required values. We will List All Values.
- Specify the default filter values. The value specified here will be applied as the default user filter value while accessing the report. When no particular value is mentioned, all the values will be displayed in the report.
- In case of having multiple user filters, you can specify the Behavior when user filters are applied. Values available for the option are:
- List only relevant values: Use this option to set up cascading User Filters i.e., if you want the second (or subsequent) User Filter's value to be dependent on the value that you have chosen in the preceding User Filter(s). For example, let's say you have one User Filter to filter Product Category, and a second filter to filter Products in a report. If you select Furniture in the Product Category filter, only the products which comes under the category Furniture will be listed in the drop-down list of the Products filter, instead of listing all the products.
- List only relevant values, with 'Show All' option: This option is similar to List only relevant values, with a Show All link. You can choose to click Show All, if you want to filter based on all the Products and not only Furniture.
- Always List All Values: Use this option to disable Cascading of User Filters and list all the values in the dropdown.
- Click the Click Here to Generate Report button.
When you view the report in View Mode, a user filter with a drop-down menu list appears on the top-left as shown in the below screenshot. From here, you can now filter product-specific data.

Adding Formula
Zoho Analytics allows you to define powerful formulas and derive custom metrics to meet your specific reporting requirements. This enables you to perform from simple calculations such as addition and subtraction to a complex calculations using built-in functions. The output of the formula adds a new column in the tabular view as well as add it as formula column in the underlying data table.
To create a formula column:
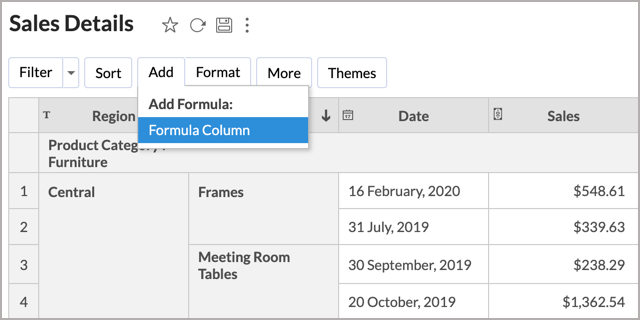
- Click the Add button > Formula Column.
- In the Add Formula Column dialog that opens, type the formula you wish to create and click OK.
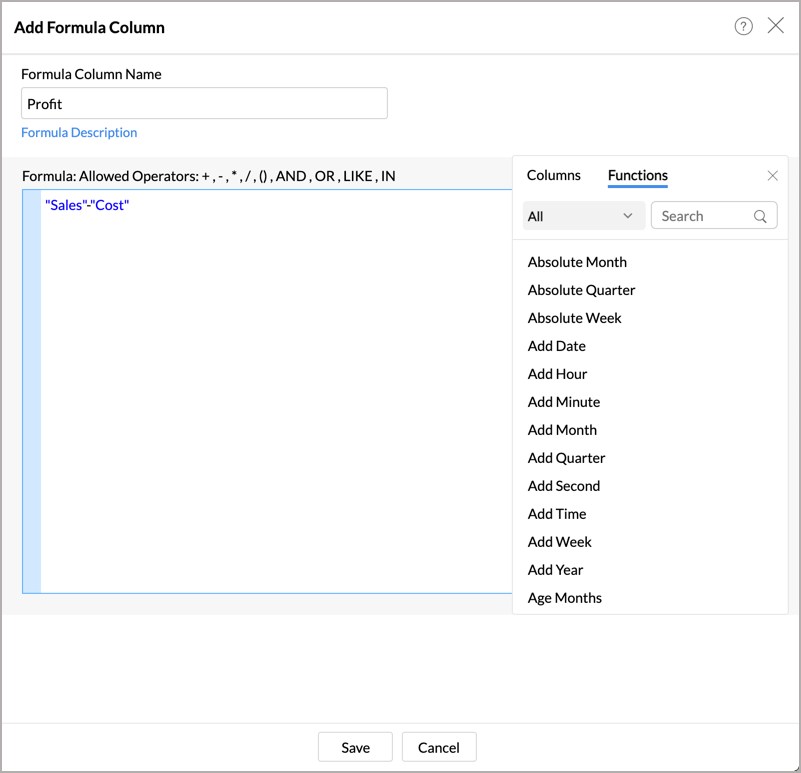
A new column using the specified formula will be added in the Tabular View.


