Step-by-step guide to creating a Gantt chart in Excel vs. Zoho Projects
Let's see how to create a Gantt chart using Microsoft Excel. Before we get into the steps involved in setting up a Gantt chart in Excel, remember that there are many easier ways to build Gantt charts. There's also more you can do with it when you use a dedicated project management solution with a built-in Gantt chart template like Zoho Projects. Plan smart and choose wisely. Now, onto how to insert a Gantt chart in Excel.
How to create an Excel Gantt chart
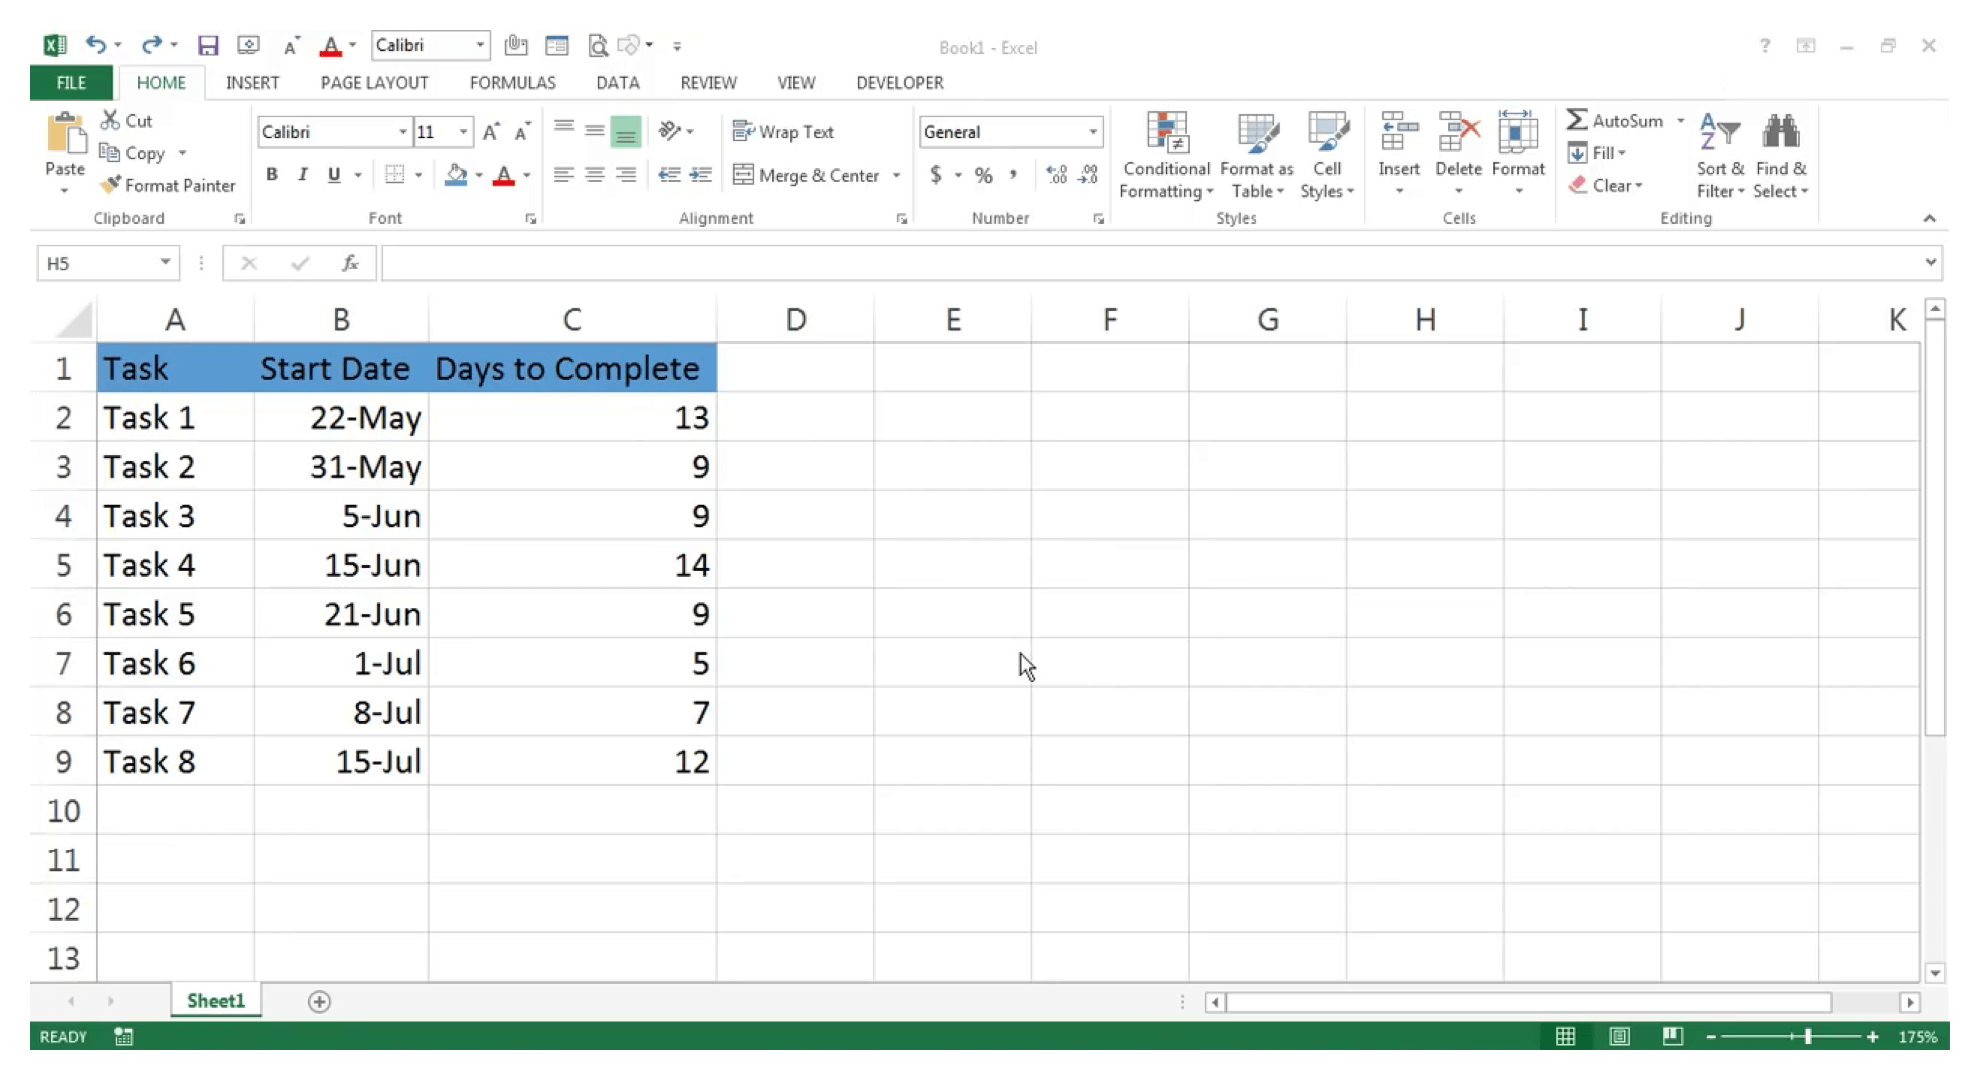
Step 01: Add your tasks on an Excel sheet Make a tabulation with task names, start date and duration of the task in an MS Excel sheet.
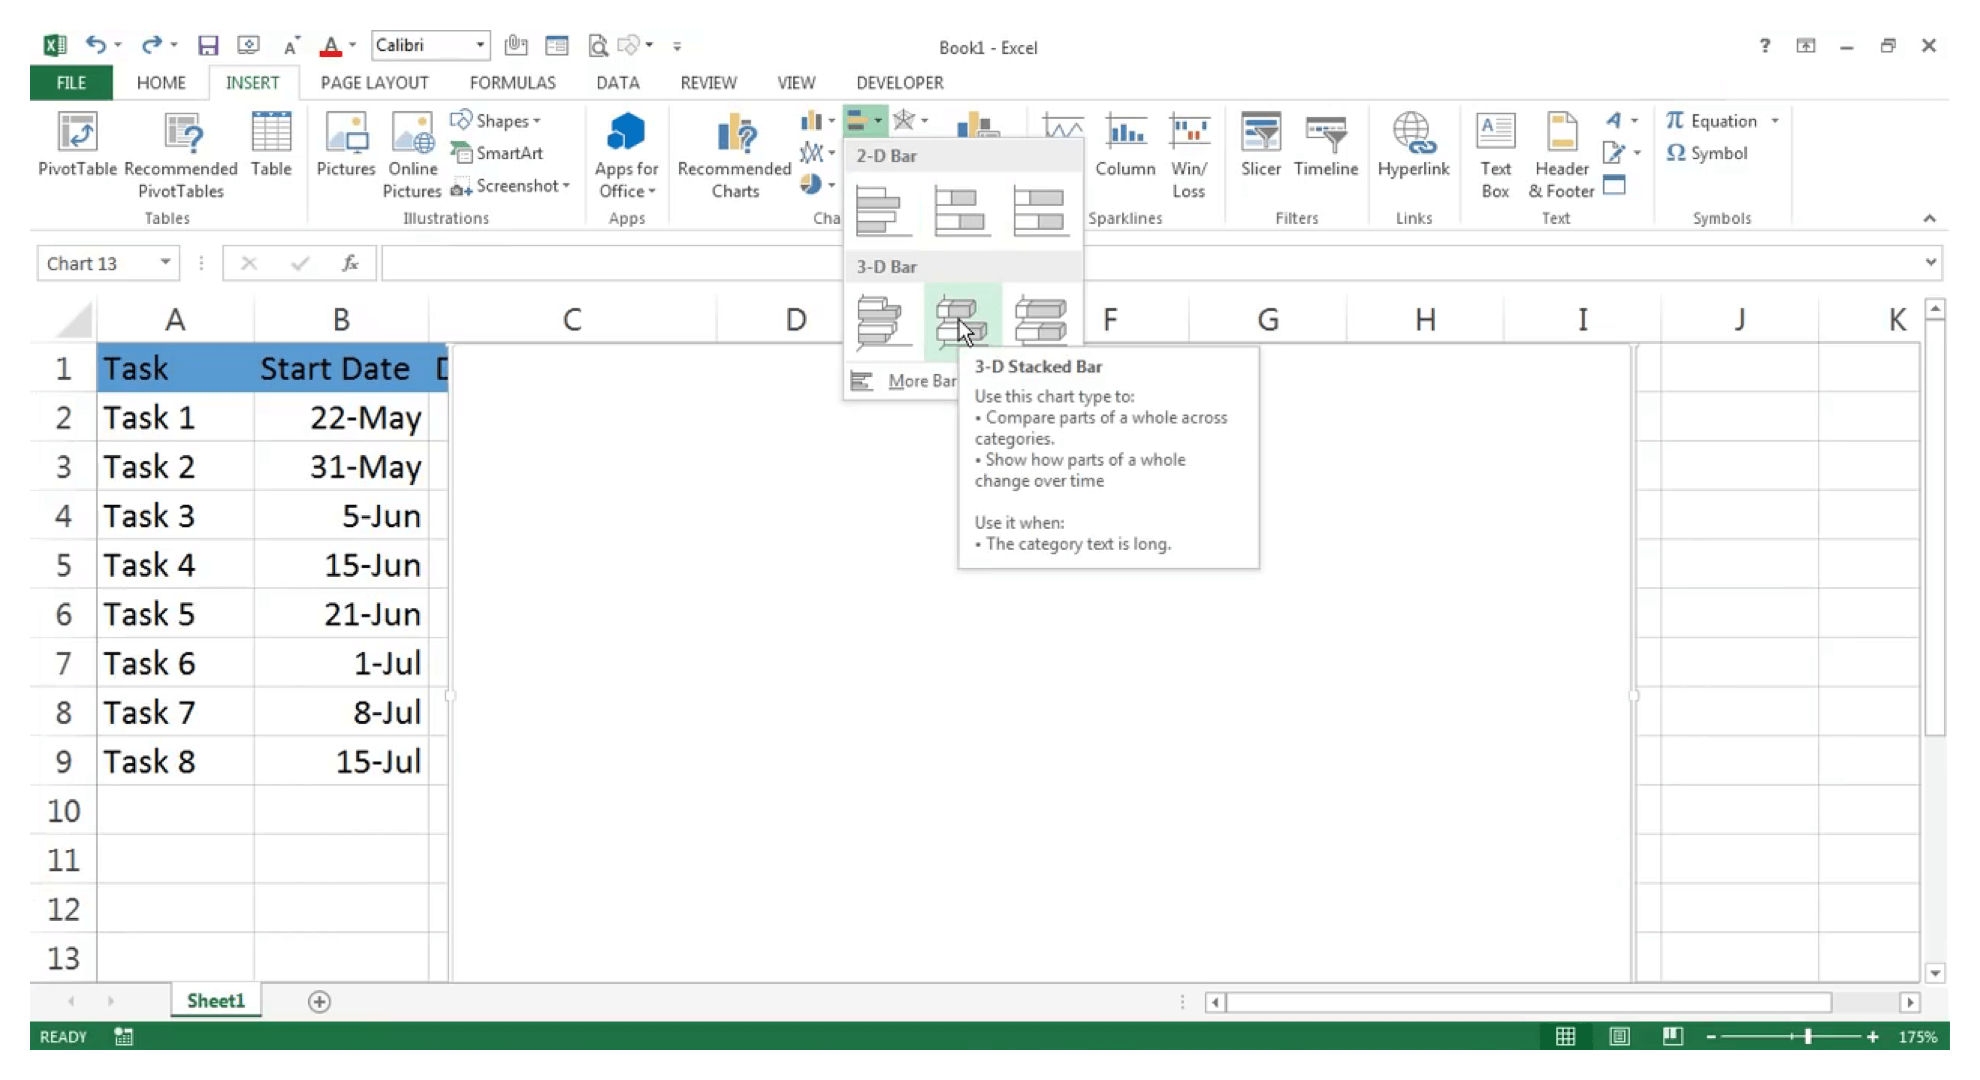
Step 02: Insert a chart Click on Insert, then on Charts. Choose 2D Stacked Bar chart. A blank chart area should appear on the screen.
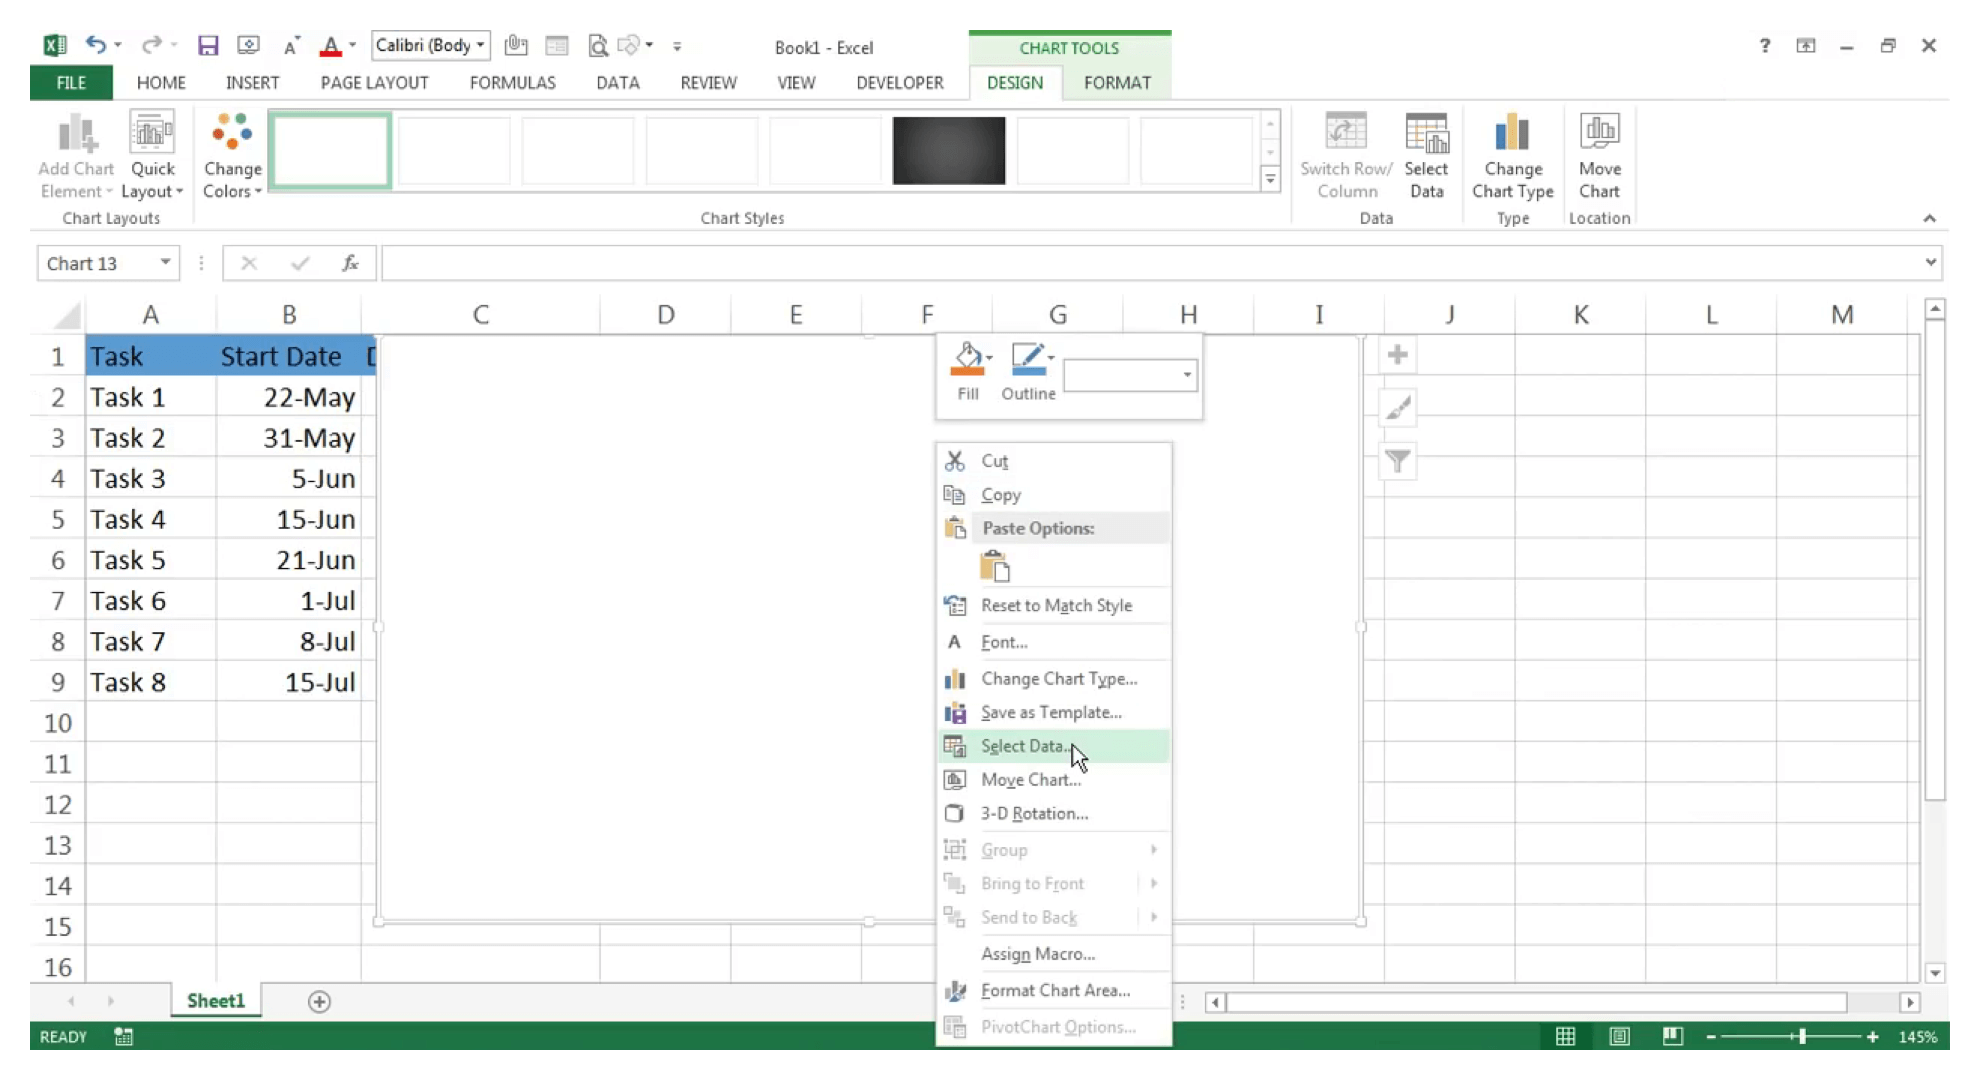
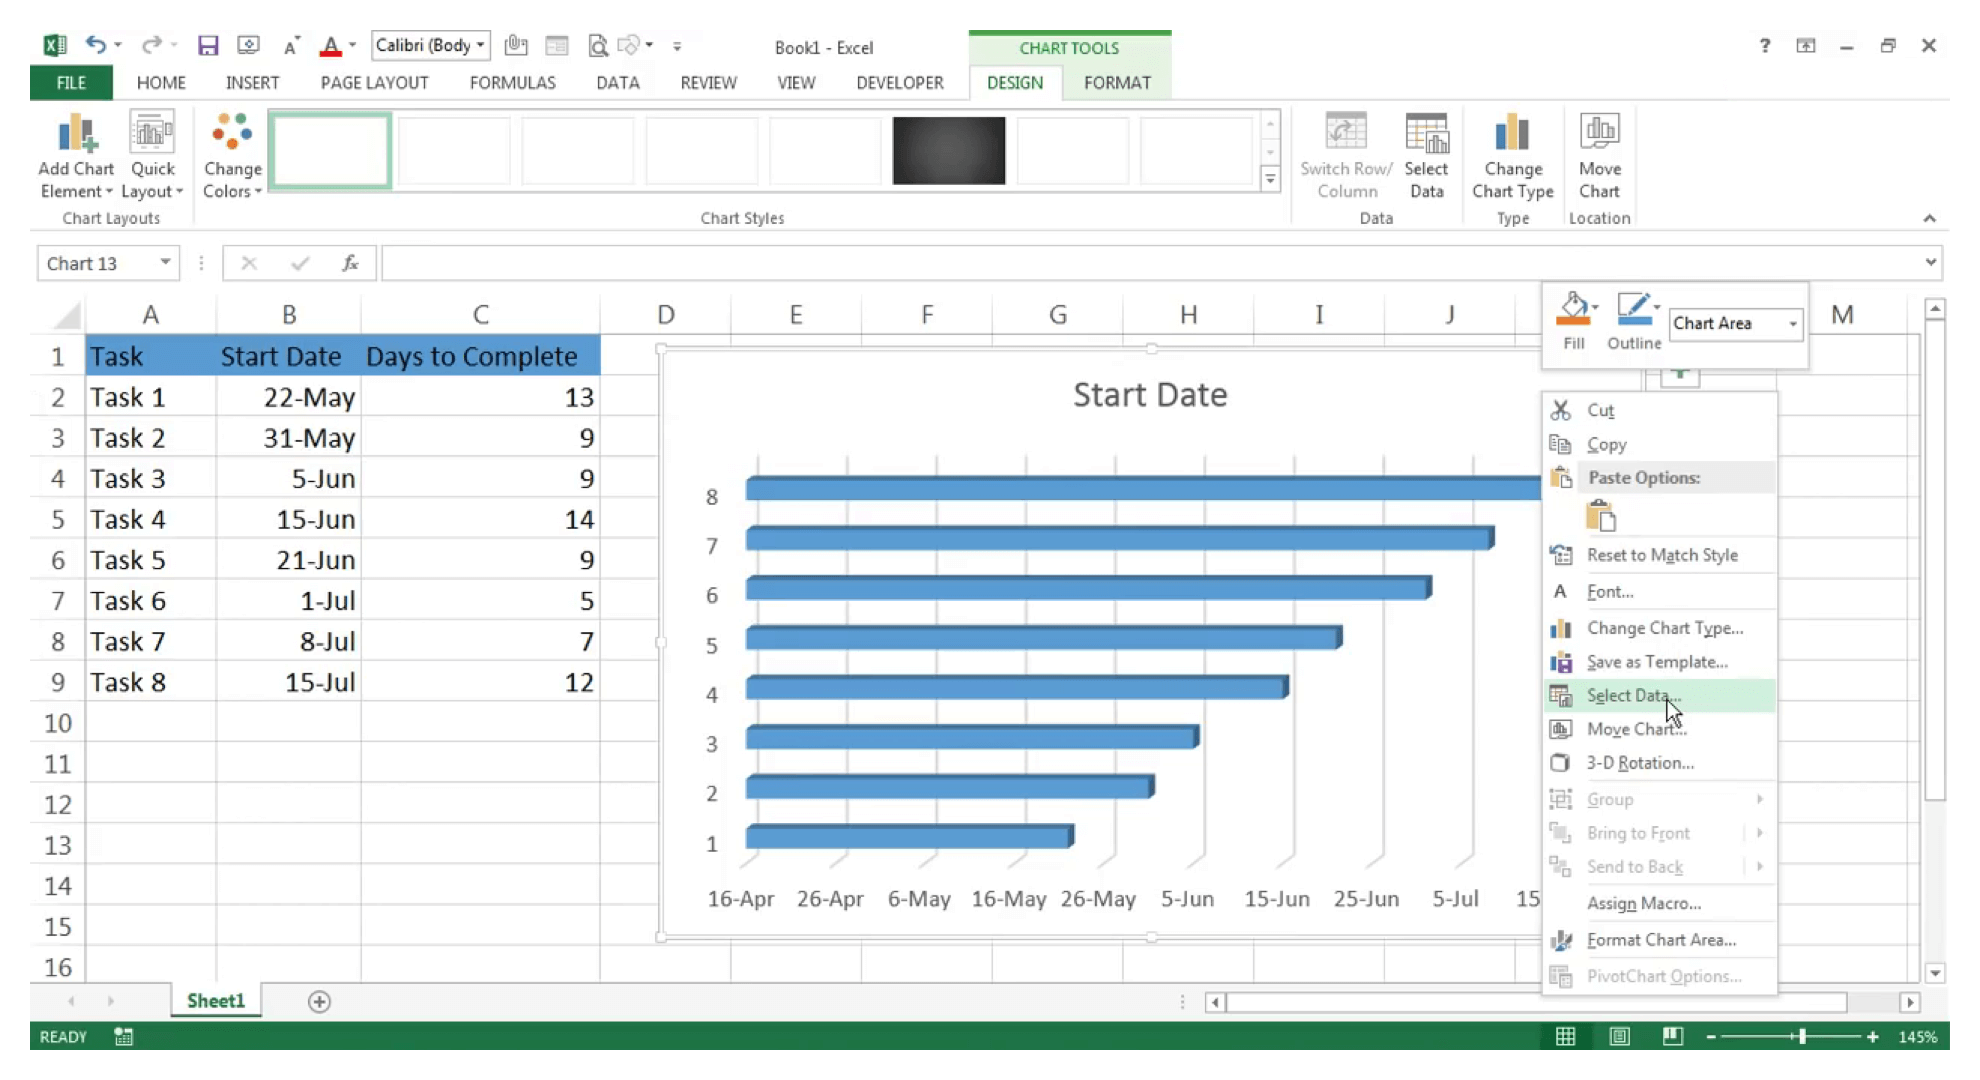
Step 03: Select data under Legend series Right click on the blank chart area and in the menu that pops up, click on Select Data.
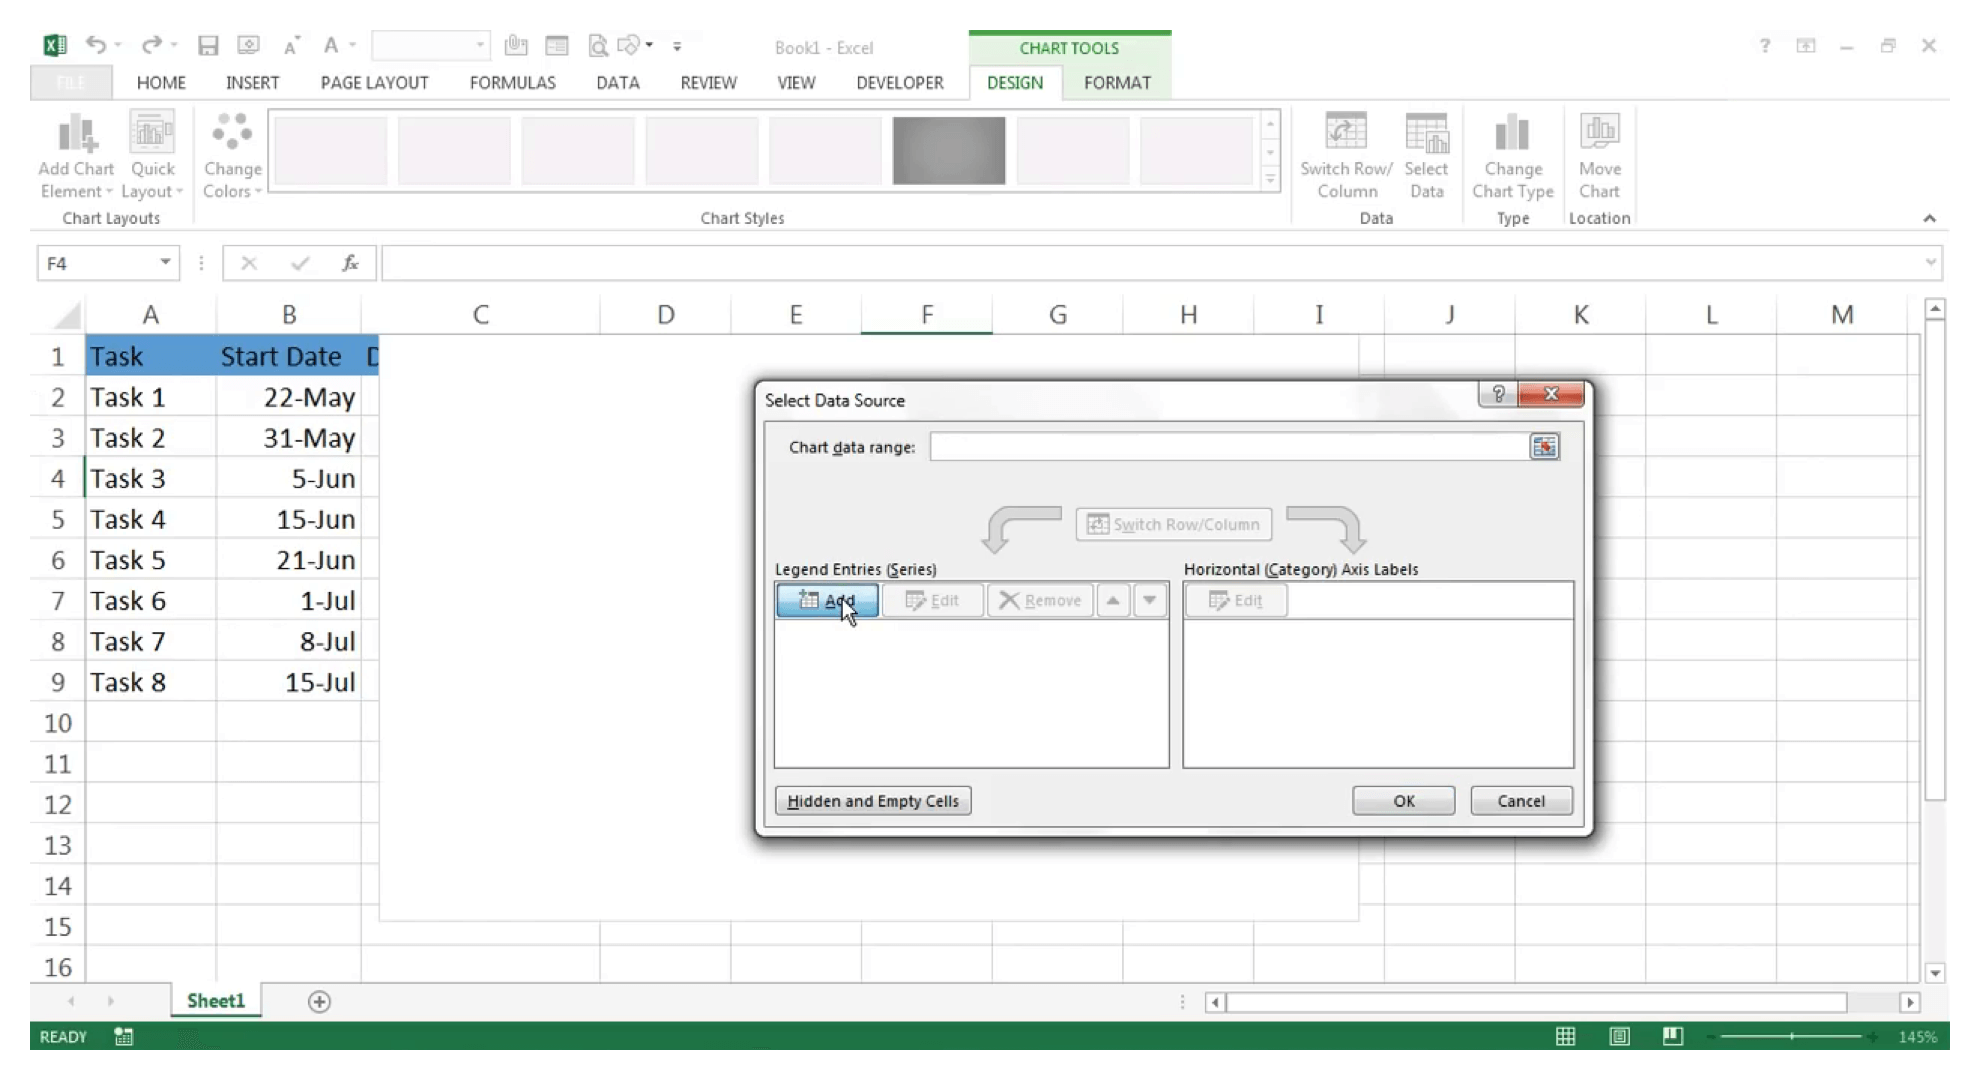
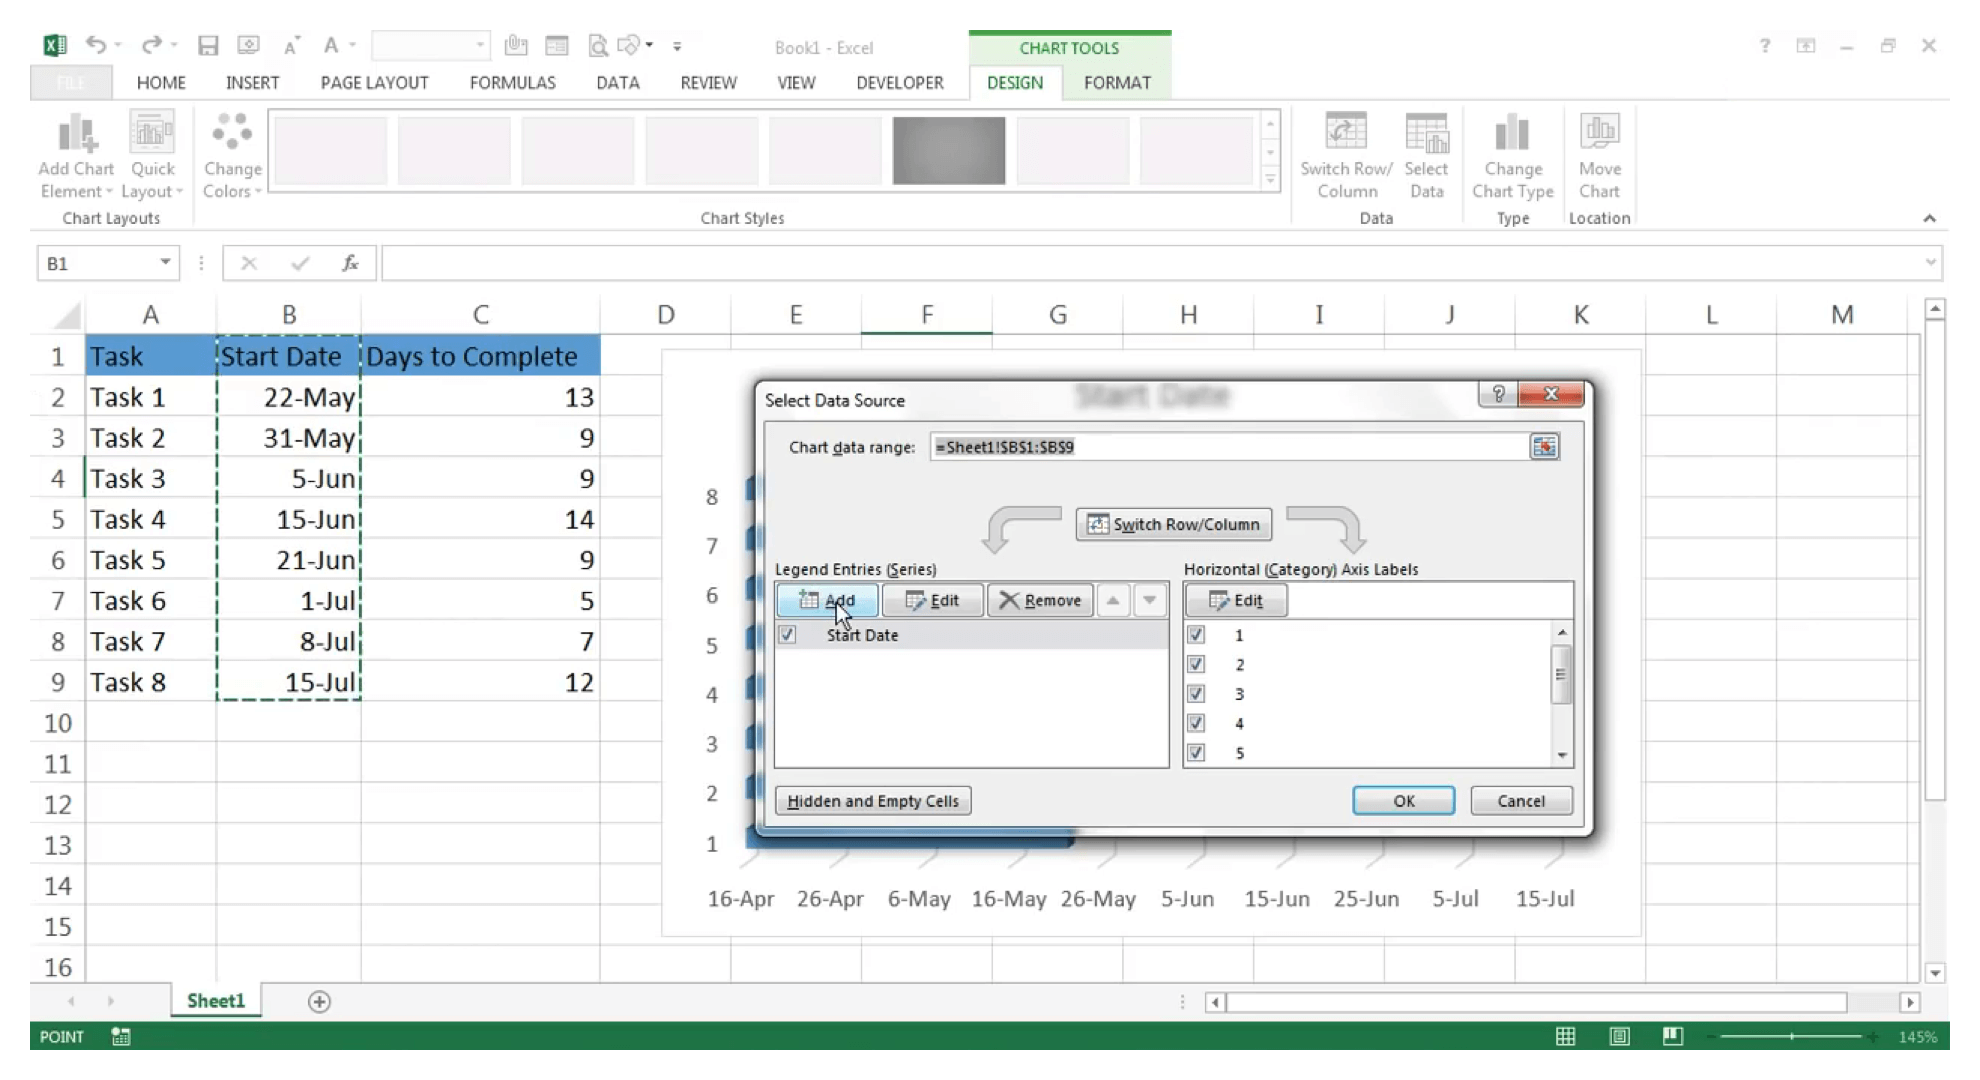
Step 04: Select Series Name A dialog box titled Select Data Source will open. Under Legend Series, click on Add.
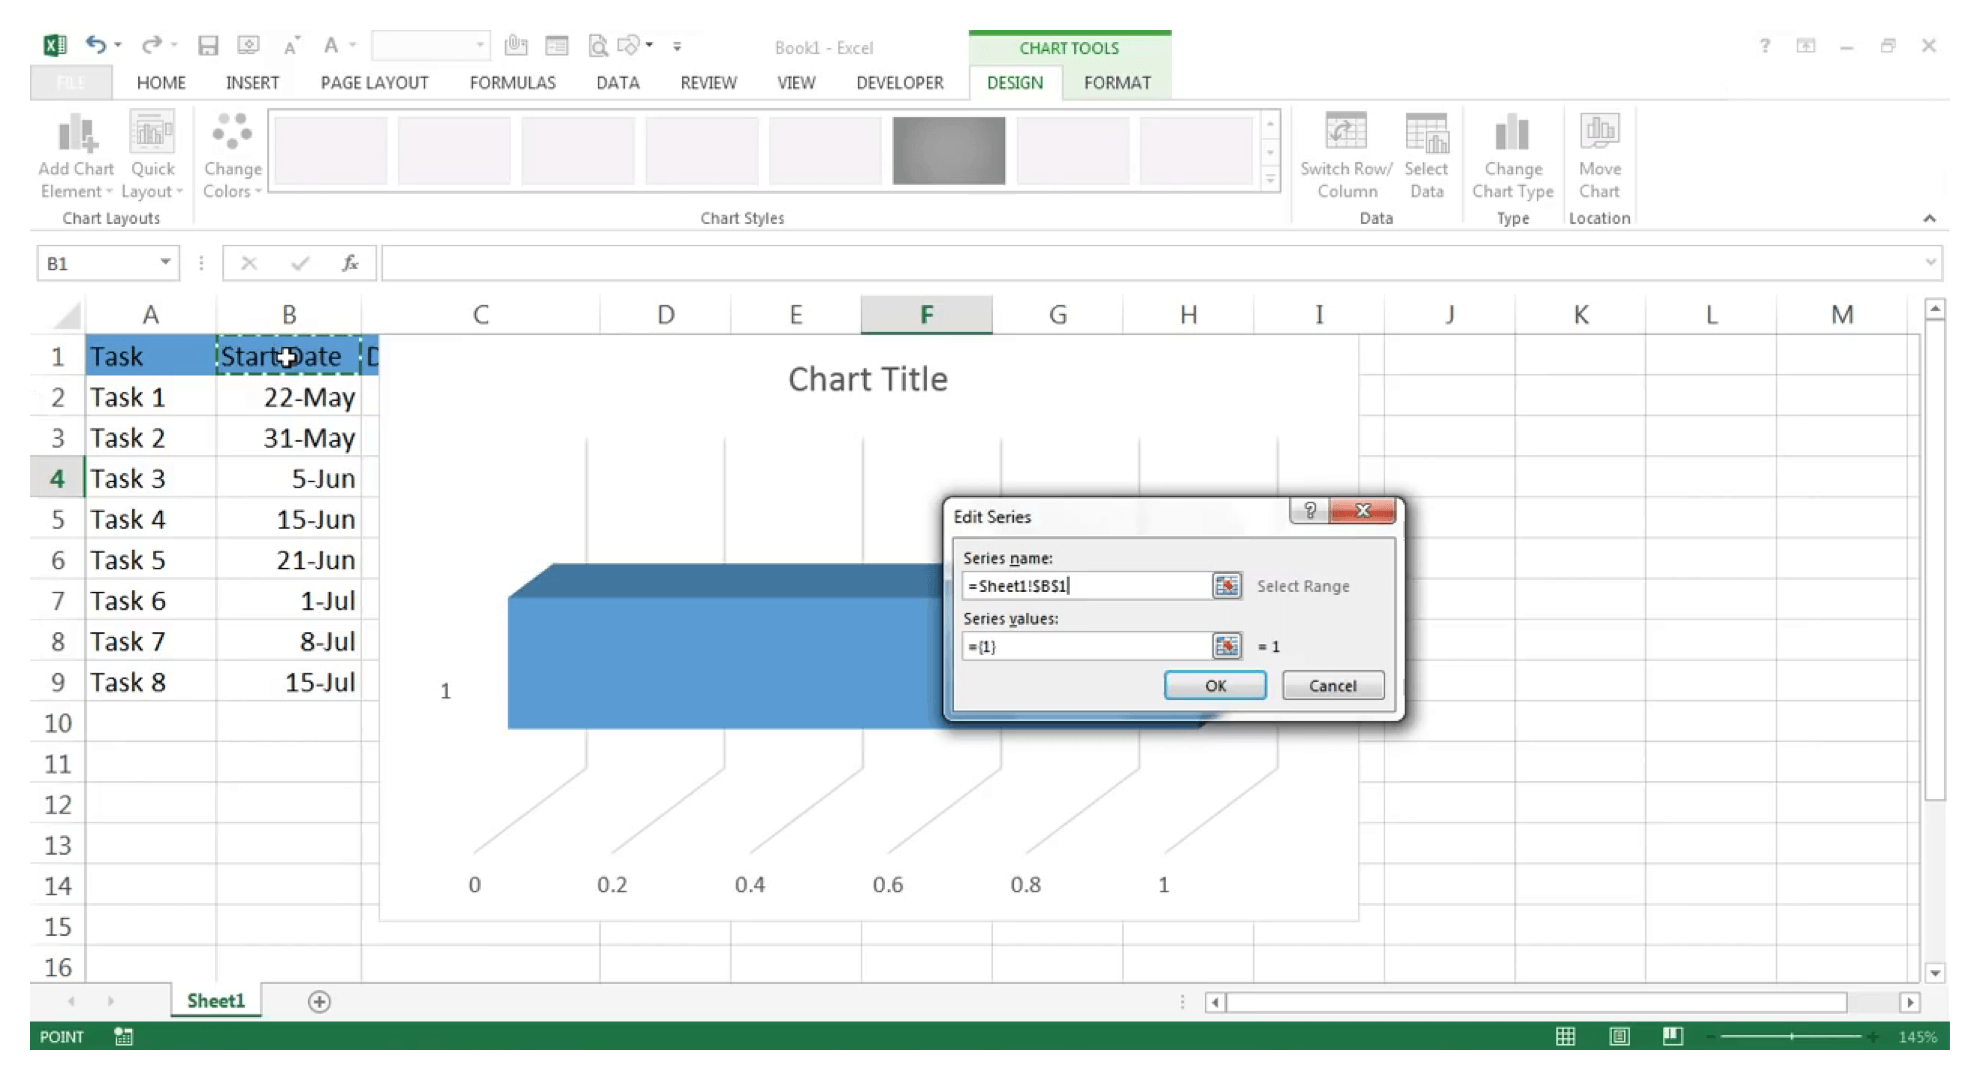
Step 05: Select the first cell The Edit Series dialog box will show up. Click on Series Name and select the first cell of the Start Date column as shown.
Step 06: Remove the default value In the dialog box, remove the default value for Series Values and select the data under the Start Date column. Click on OK.
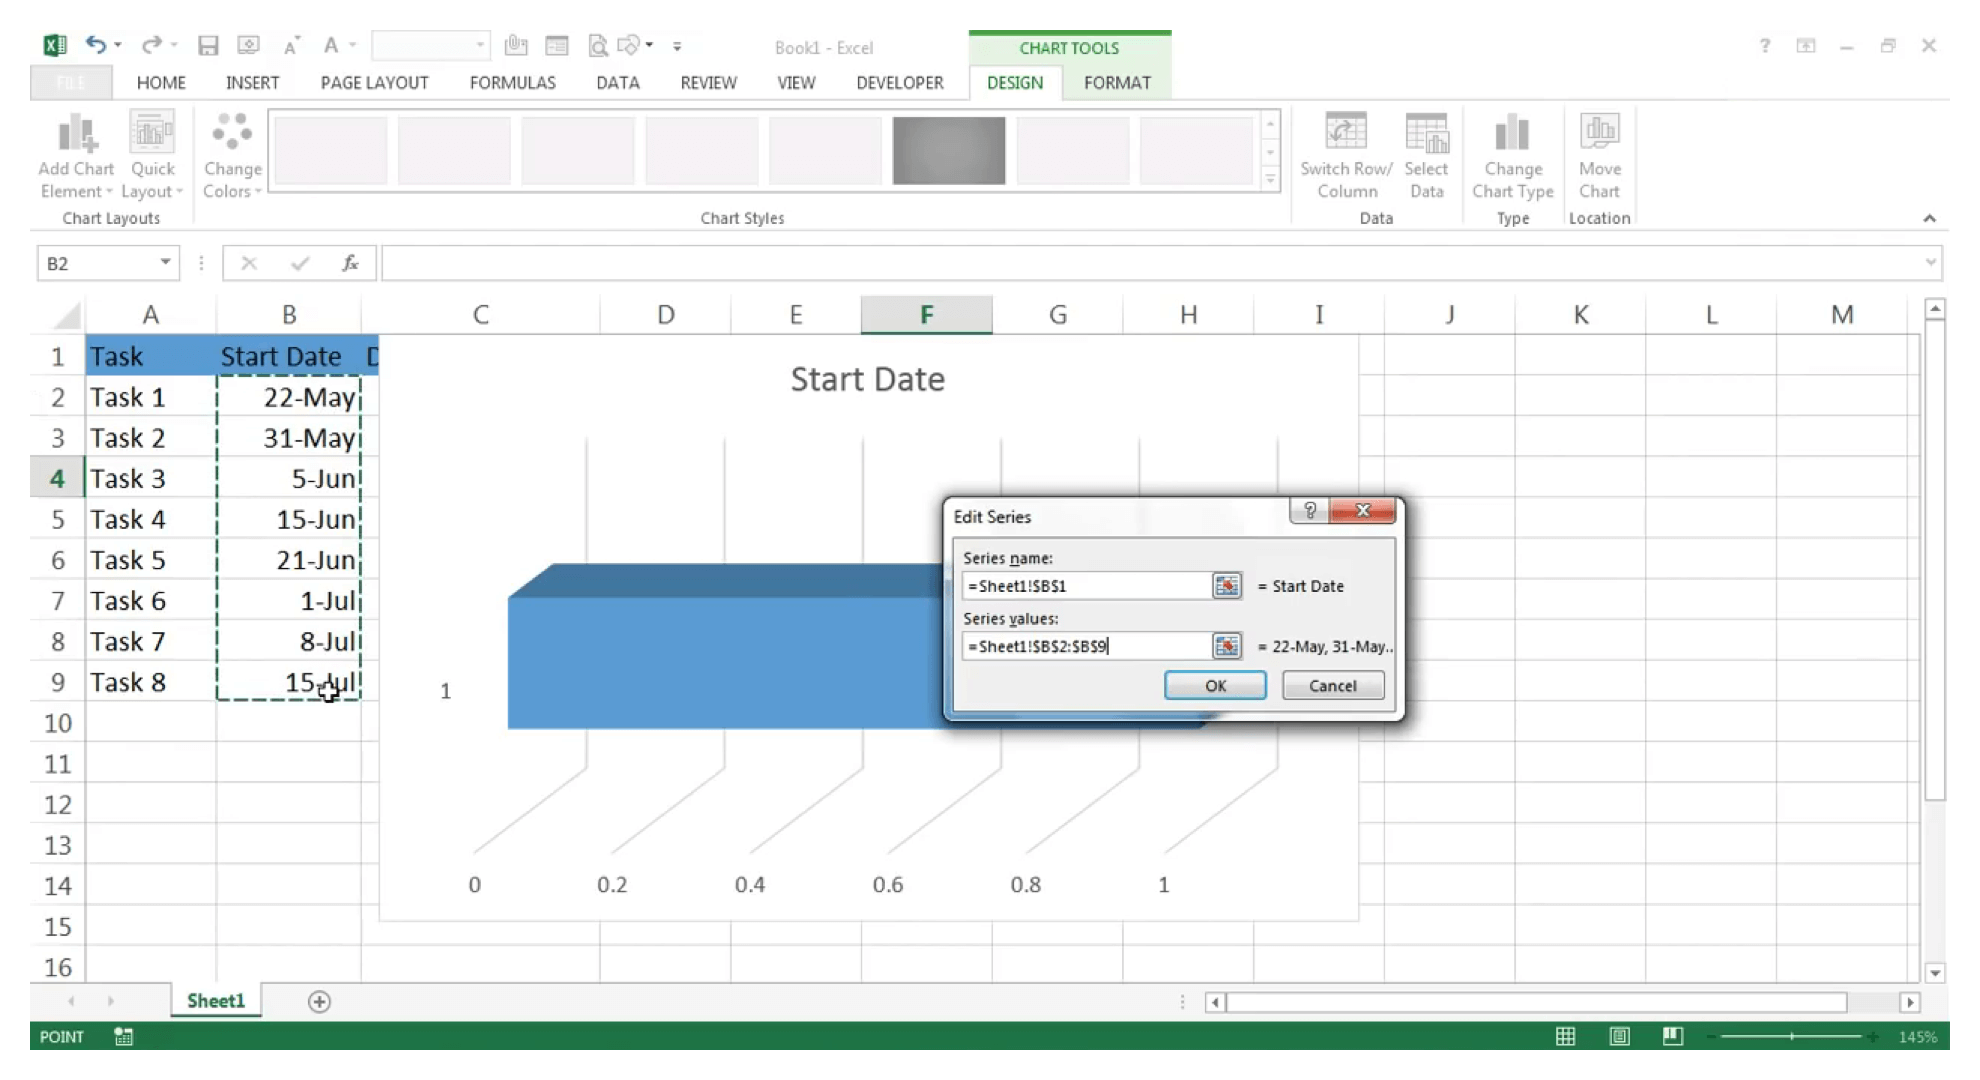
Step 07: Click on OK You will be back on the Select Data Source dialog box. Click on OK.
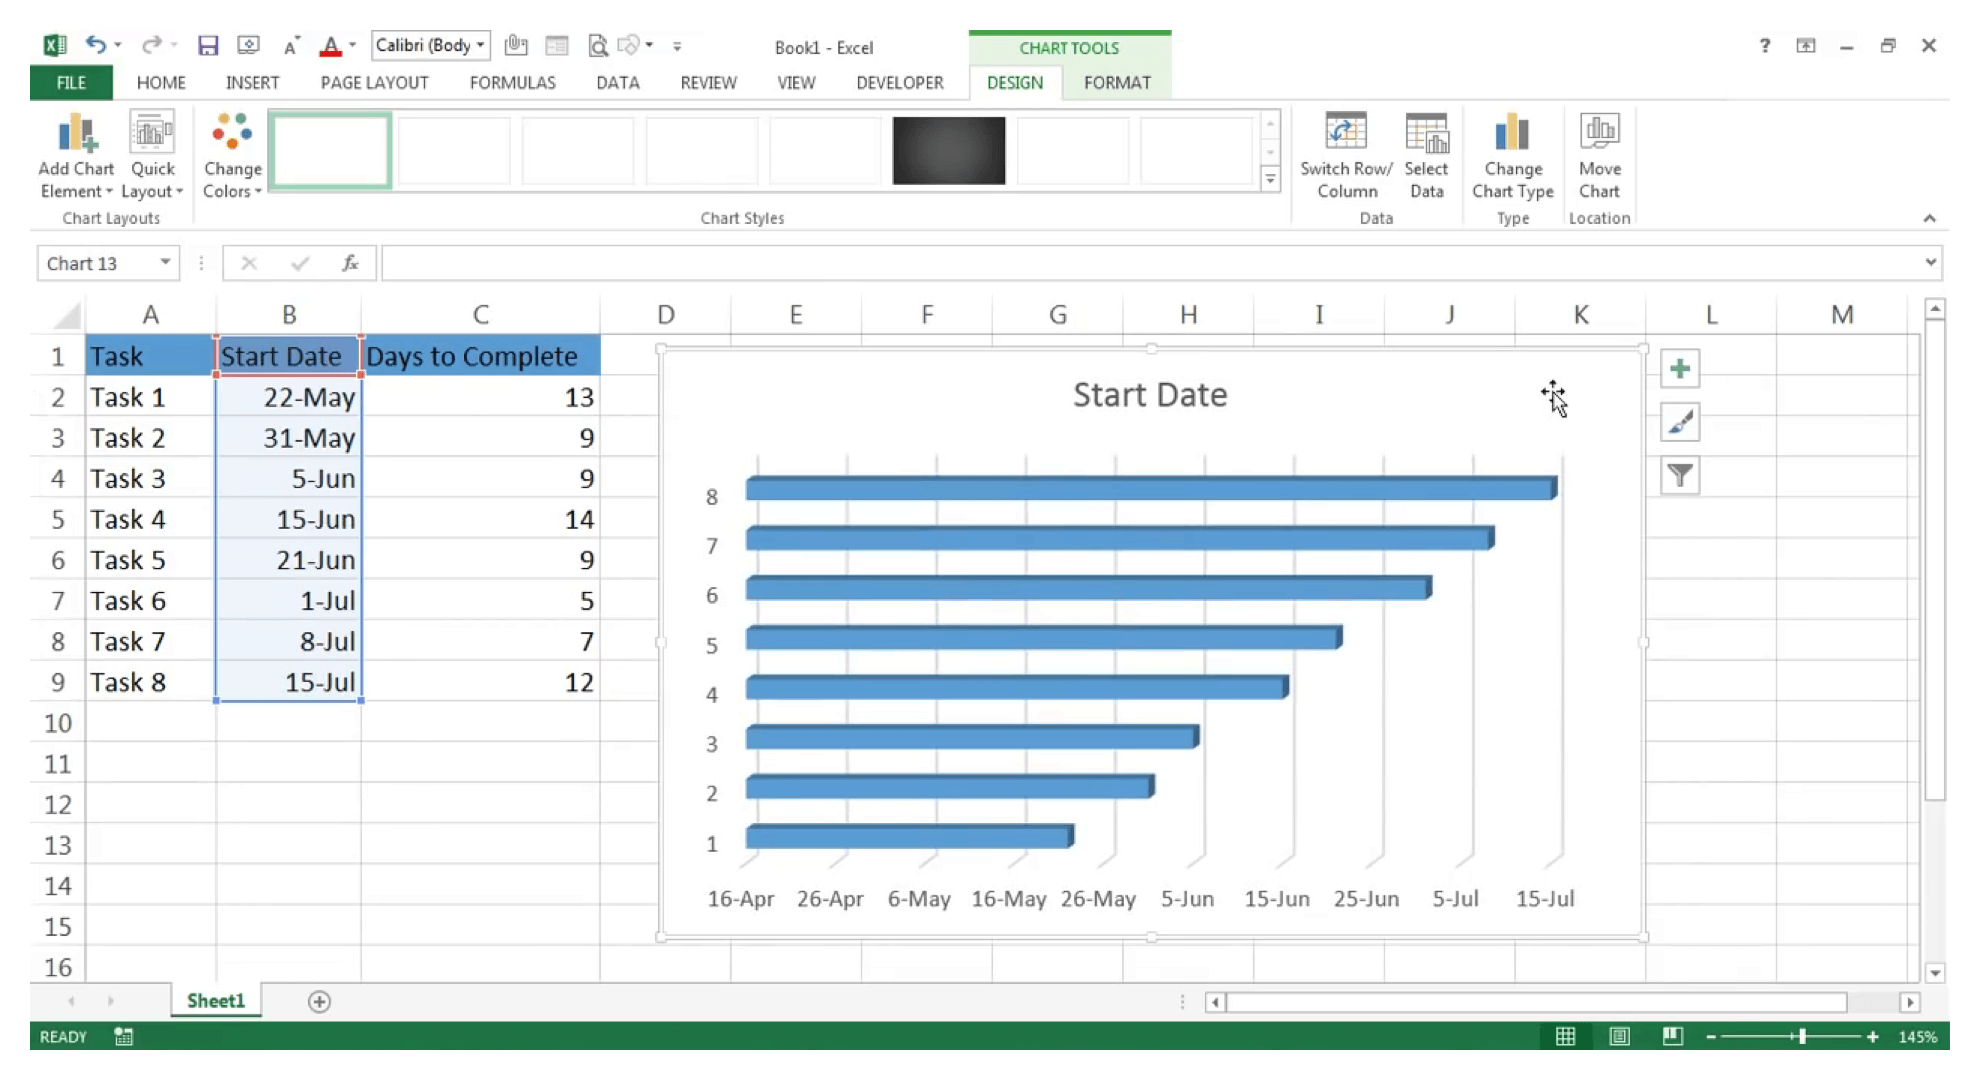
Step 08: Move or resize your chart The chart area will be filled with bars now. Move the chart so that it does not block the data in the sheet.
Step 09: Select data again Right click on an empty space within the chart, and click on Select Data in the context menu.
Step 10: Click on Add In the Select Data Source dialog box, under Legend Entries (Series), click on Add.
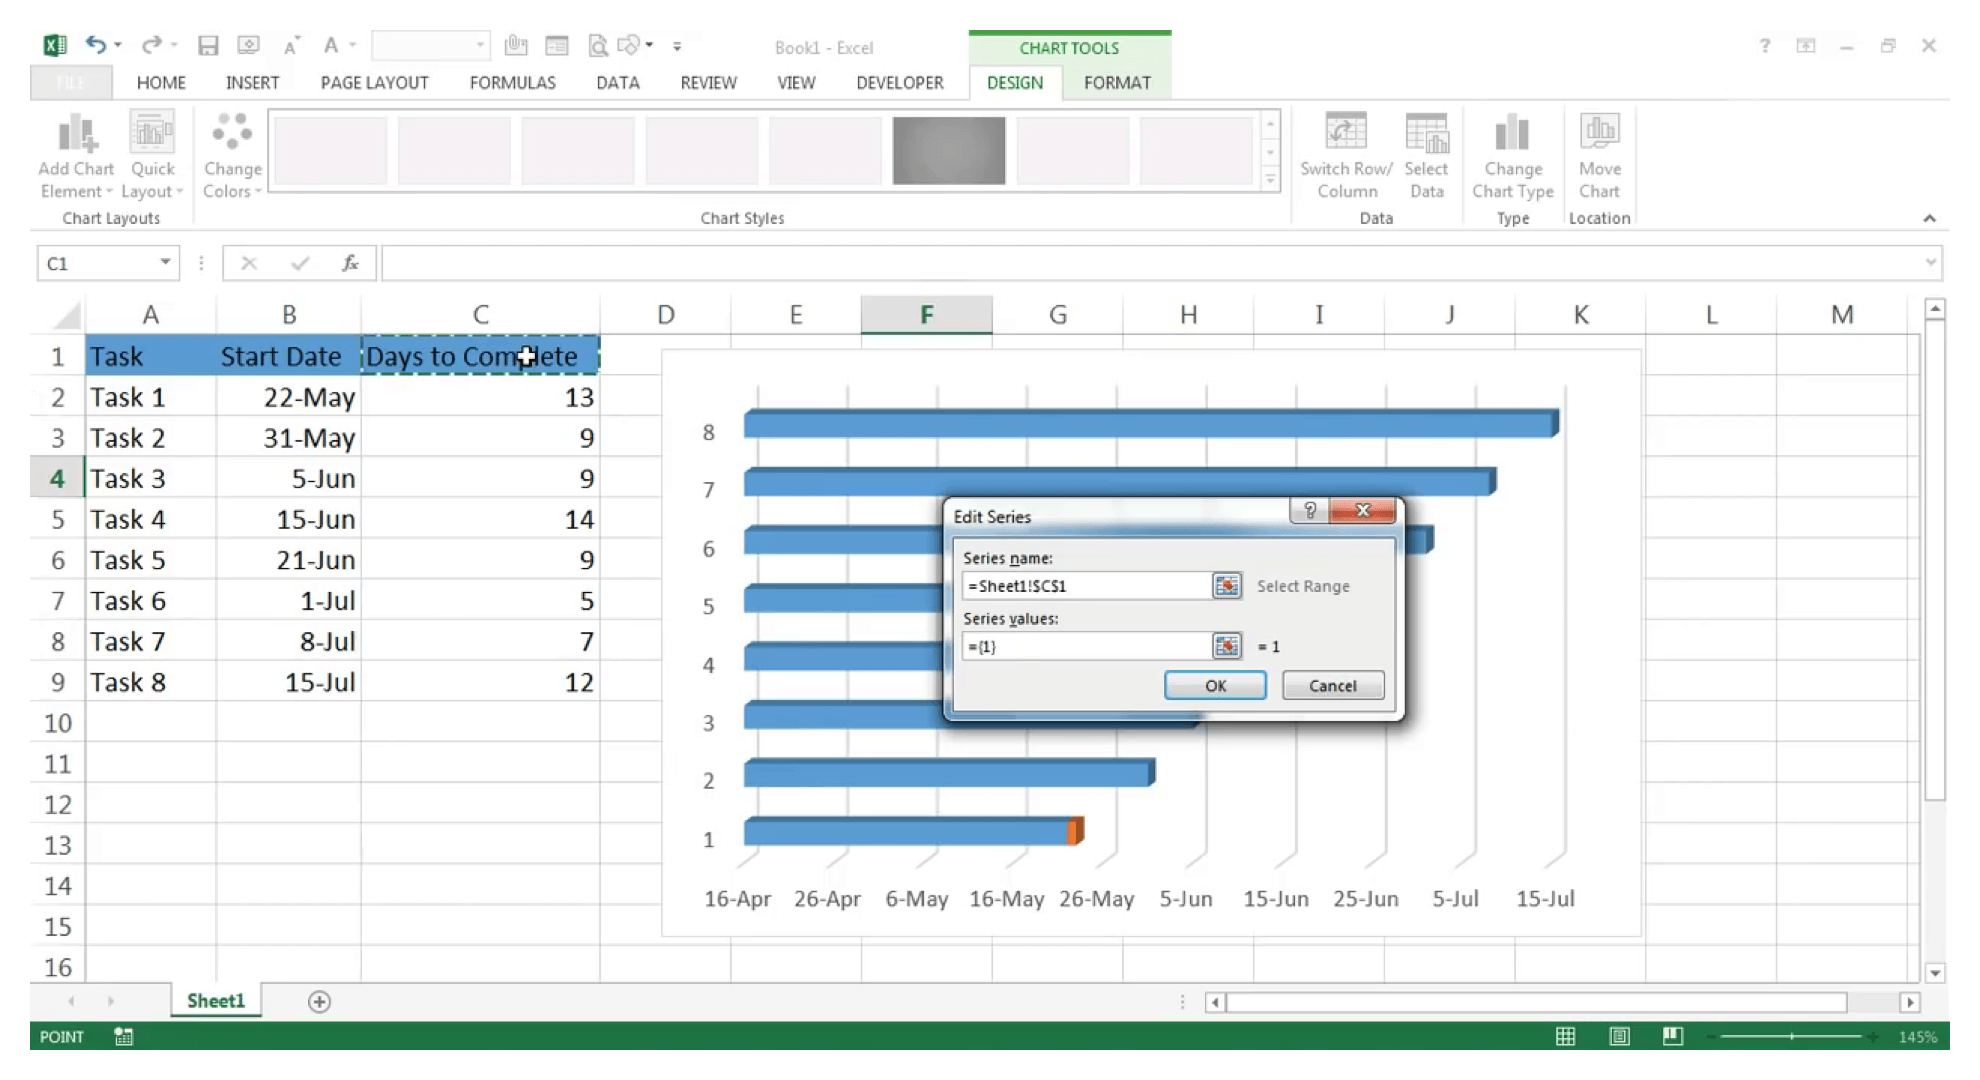
Step 11: Select the Days To Complete cell The Edit Series dialog box appears. Click on Series name and then select the Days to Complete cell as shown.
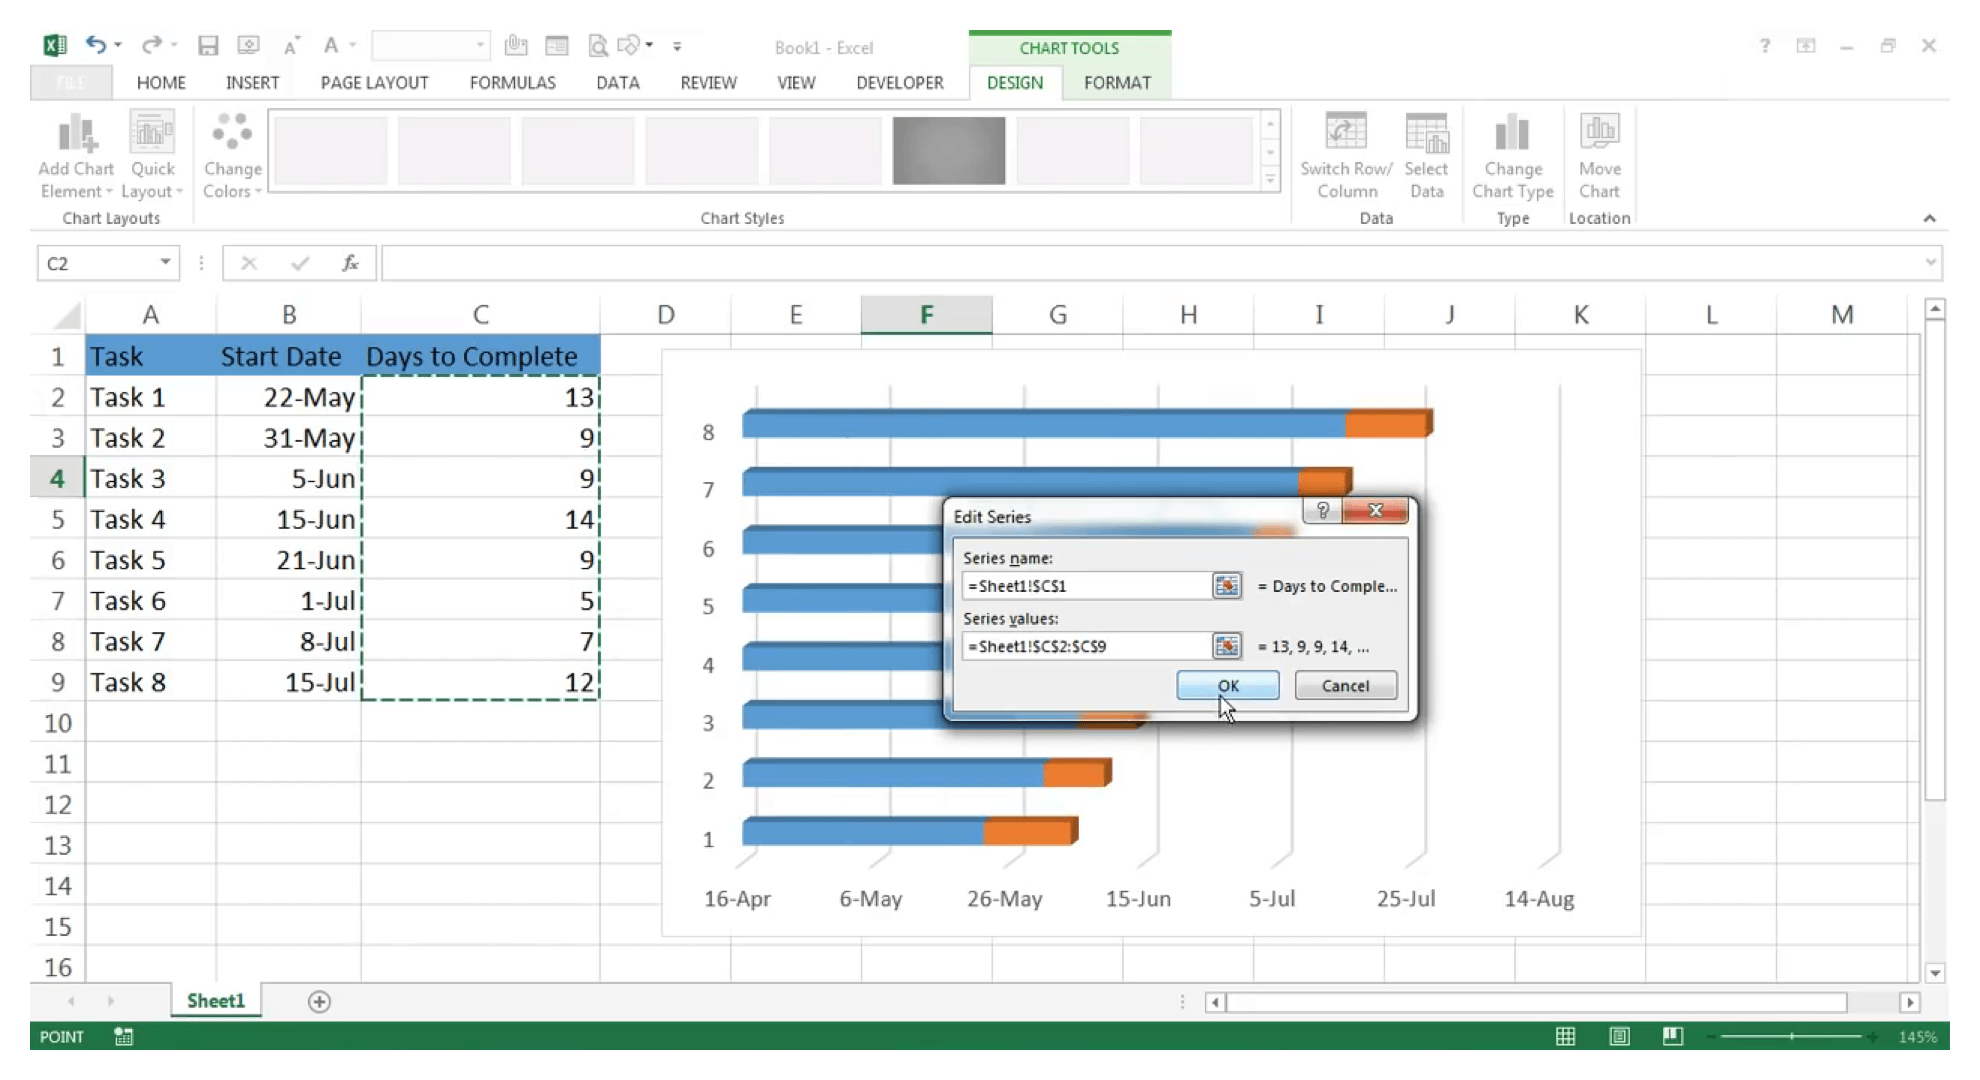
Step 12: Select data under "days." Remove the default value under Series values and select the data under Days to Complete column. Click on OK.
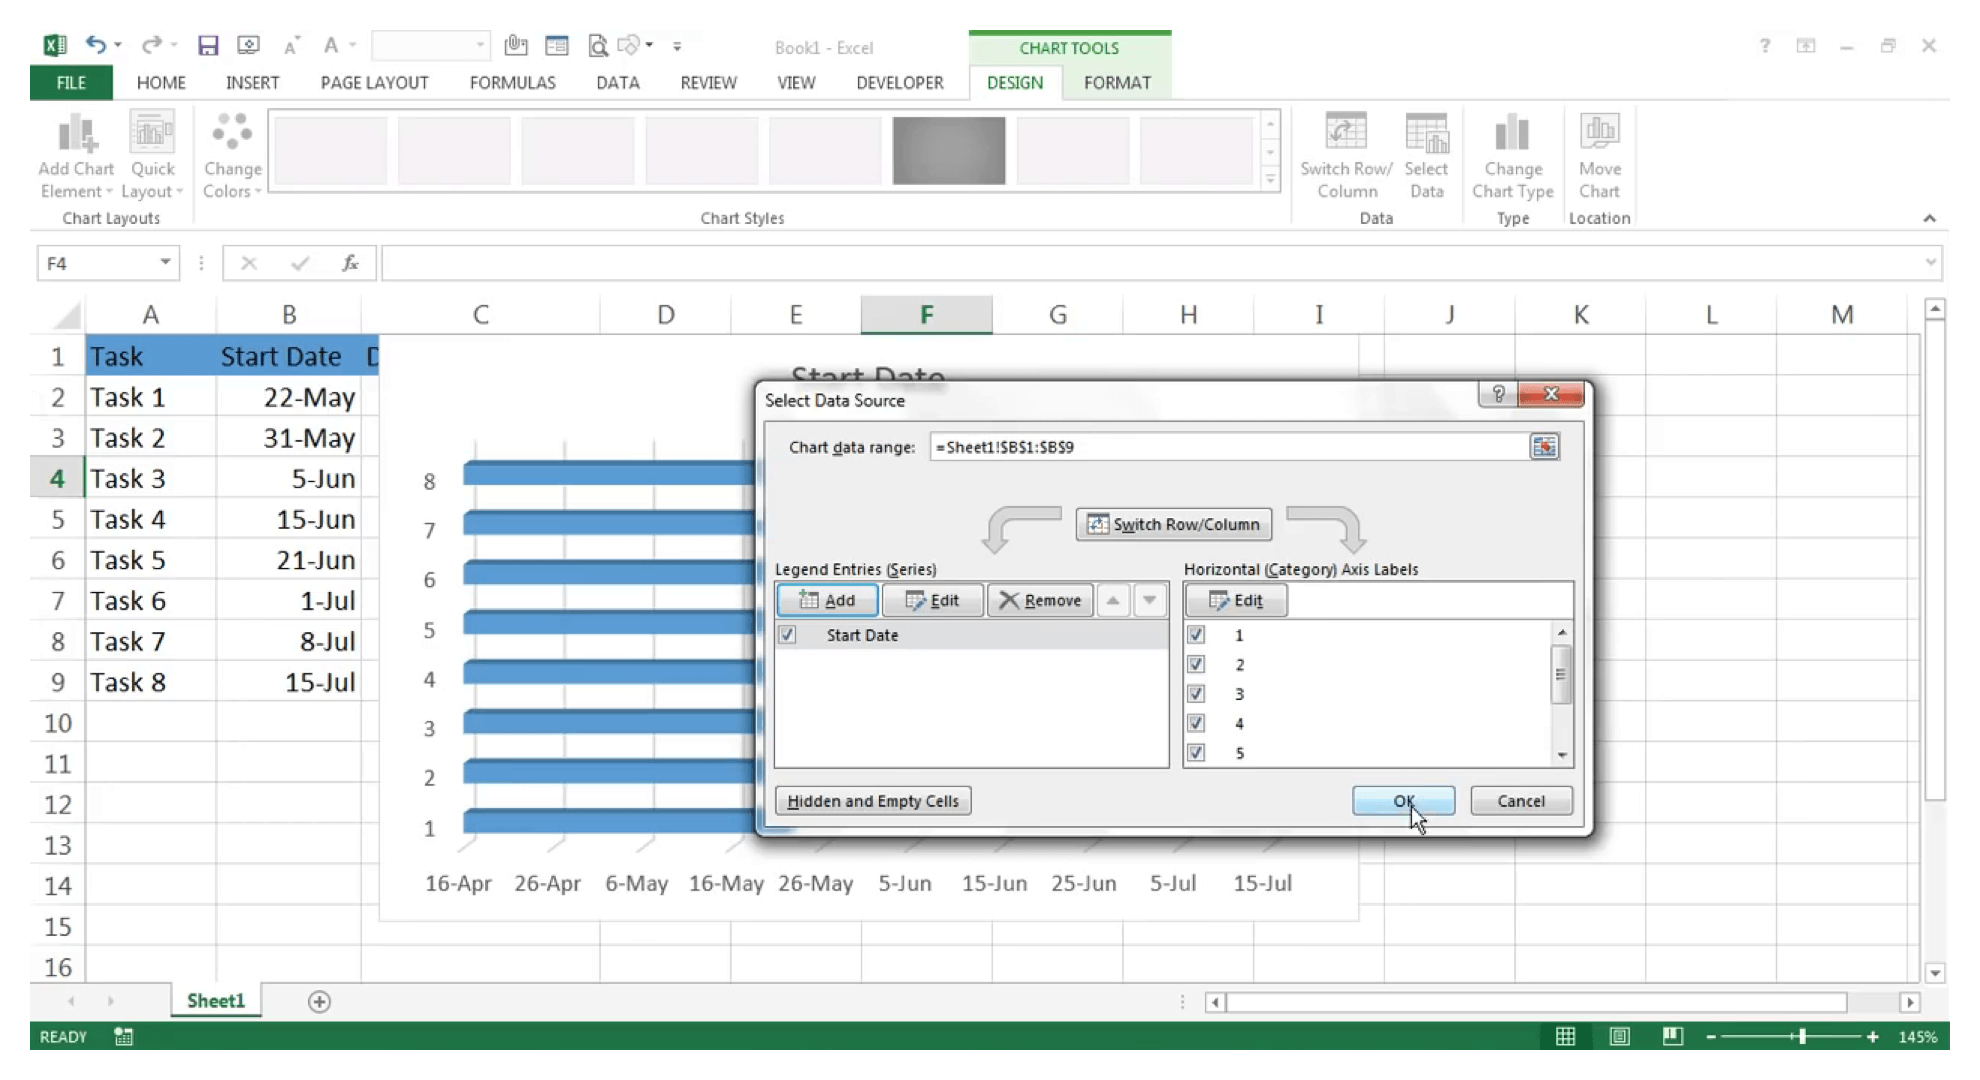
Step 13: Click on edit under the Horizontal Axis Label You will be back on the Select Data Source dialog box. Under the Horizontal Axis Label, click on Edit.
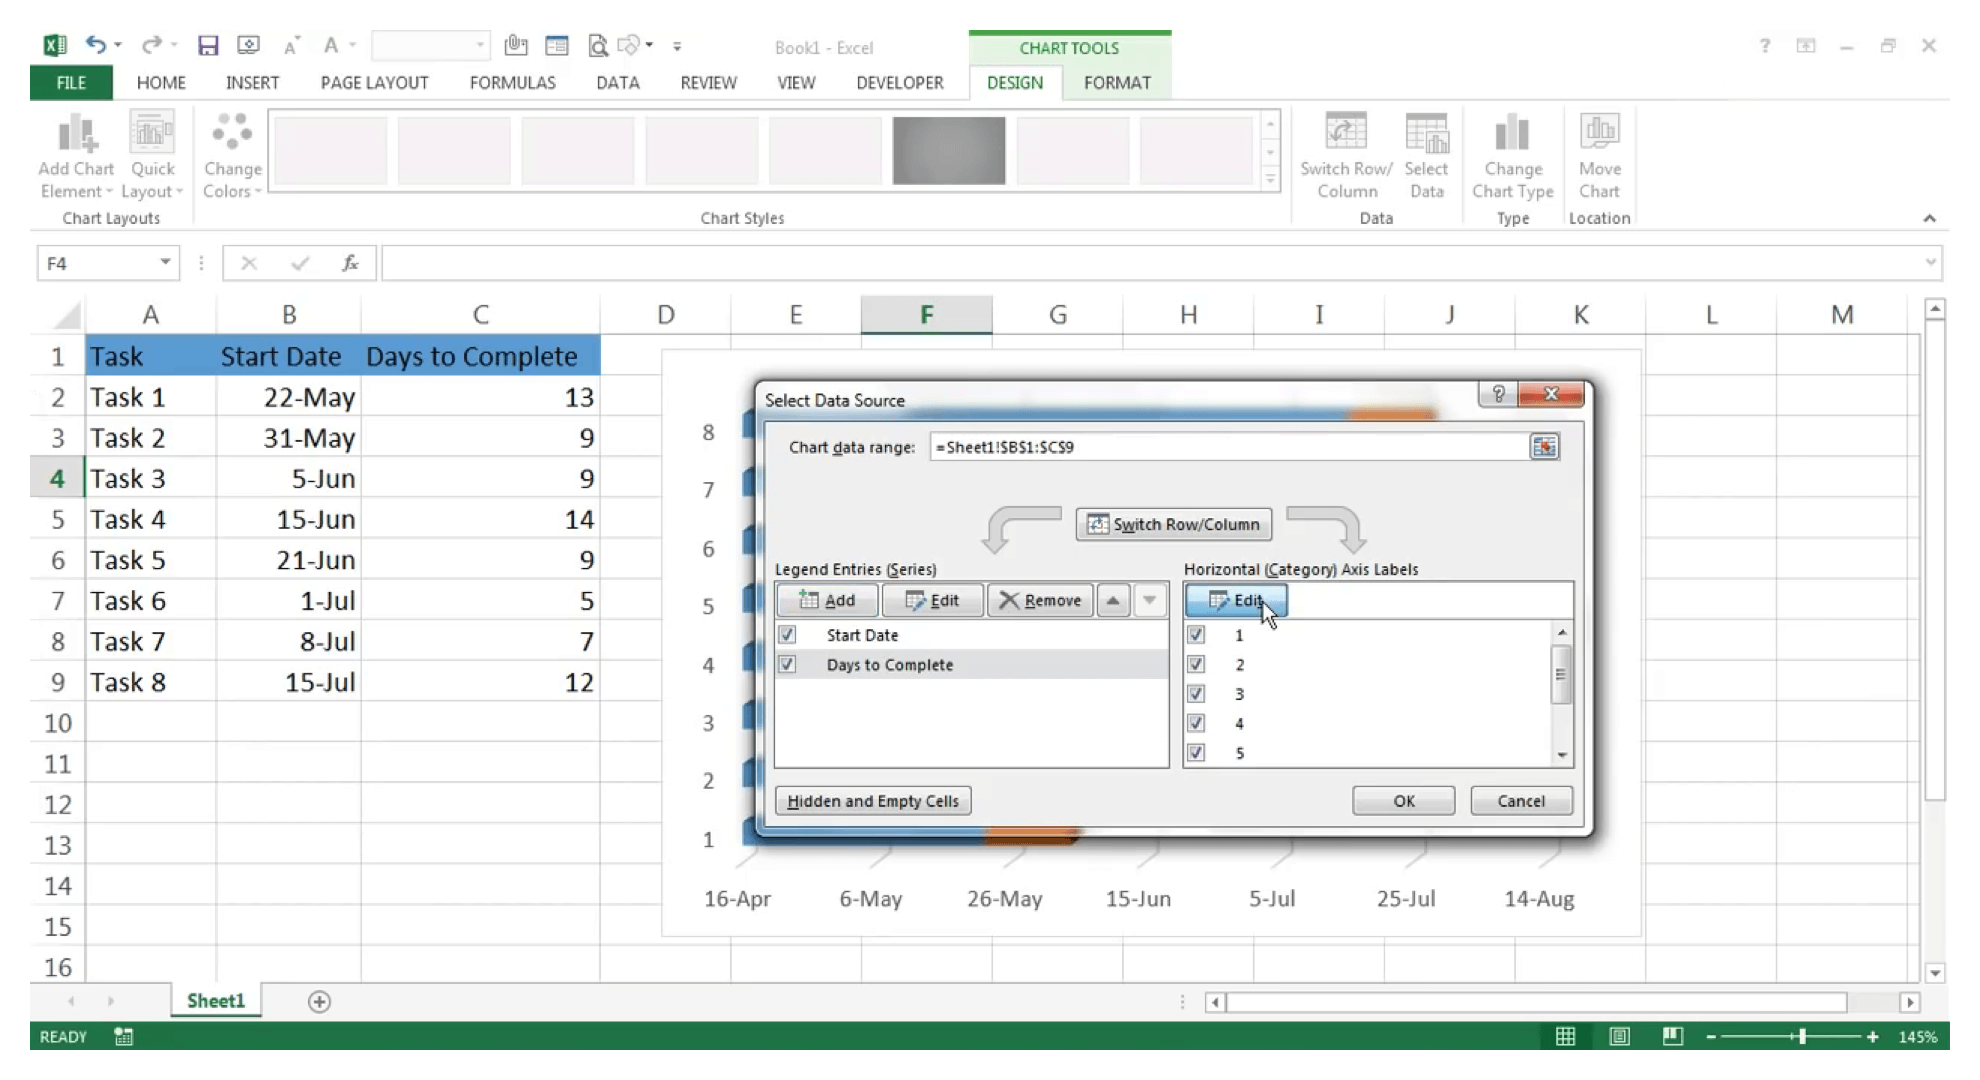
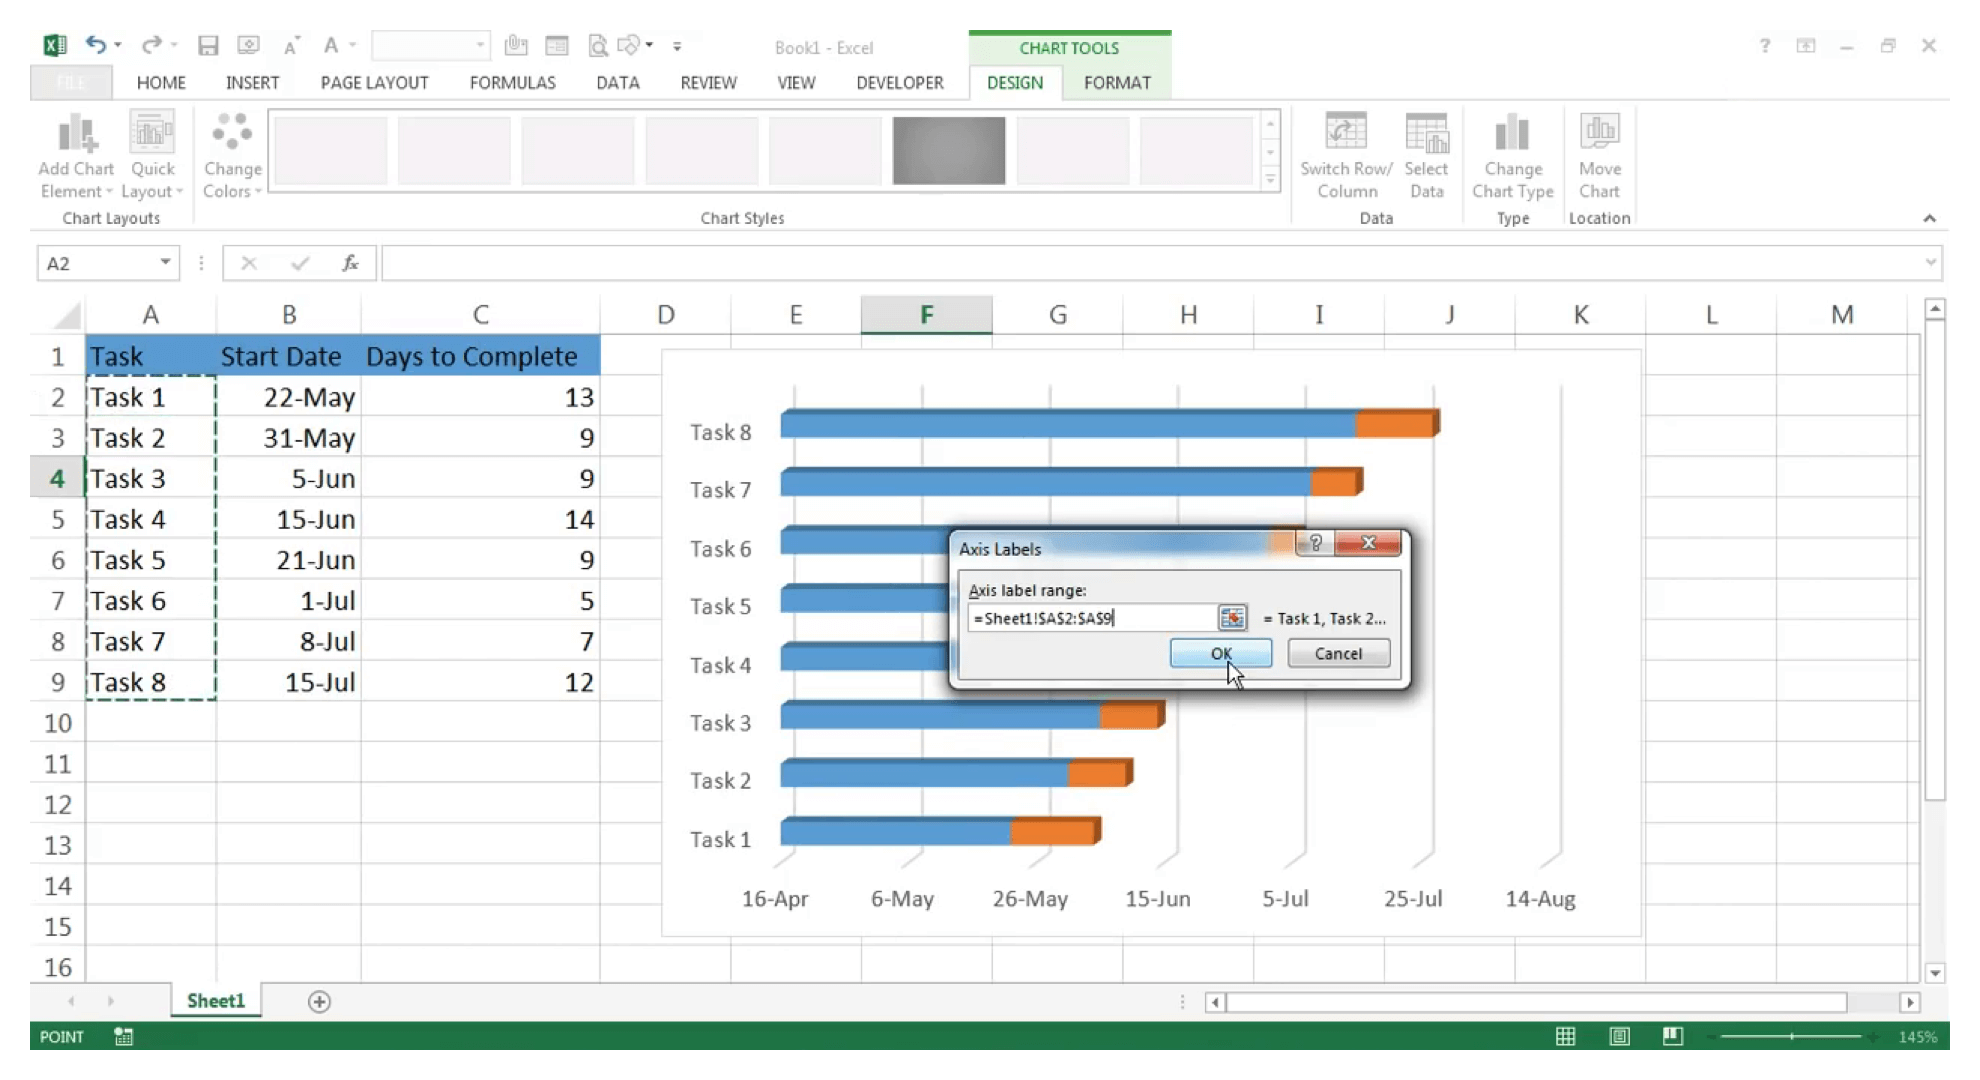
Step 14: Click on Axis Label Range In the Axis Labels dialog, click on Axis label range, and select the cells with the names of the tasks. Click on OK.
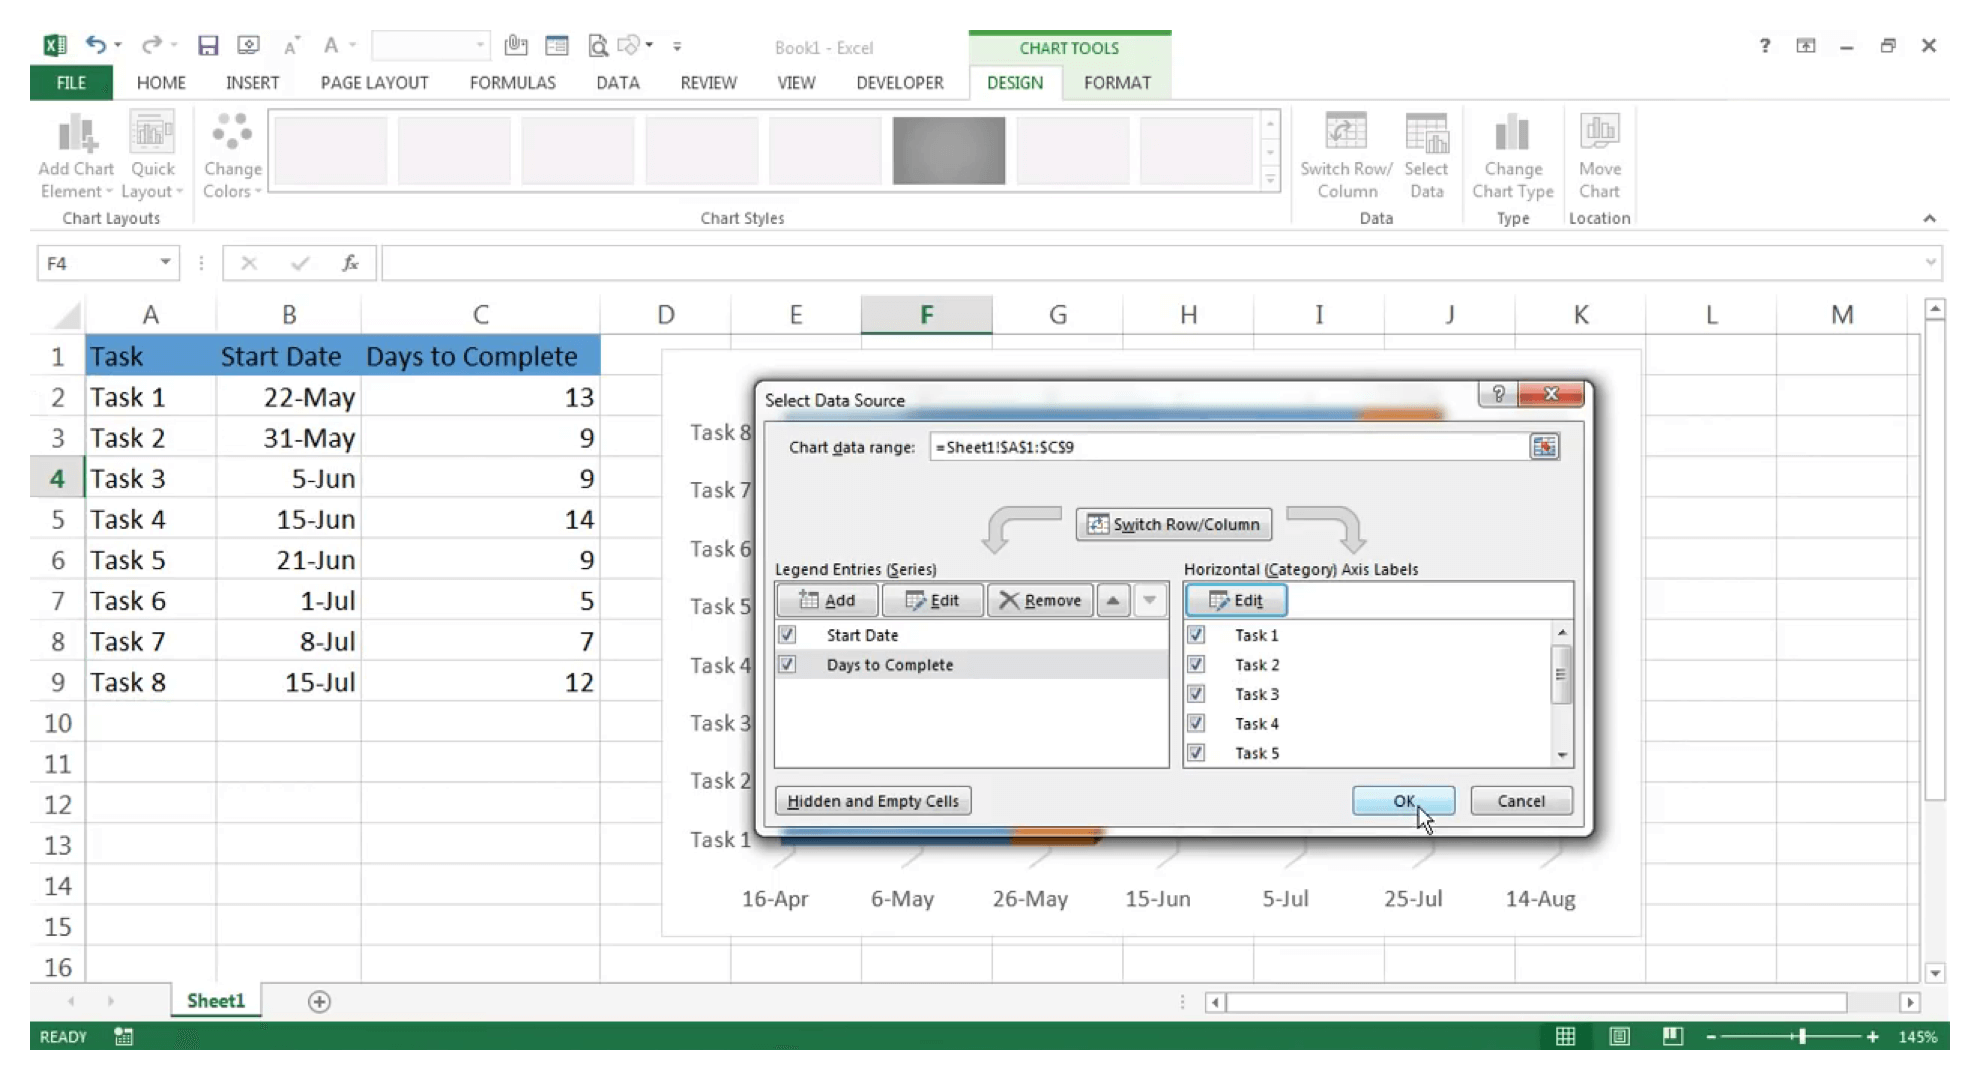
Step 15: Finalize your data to make a Gantt chart Back again on the Select Data Source dialog, click on Ok. We have now selected all the data required to make our Gantt chart Excel.
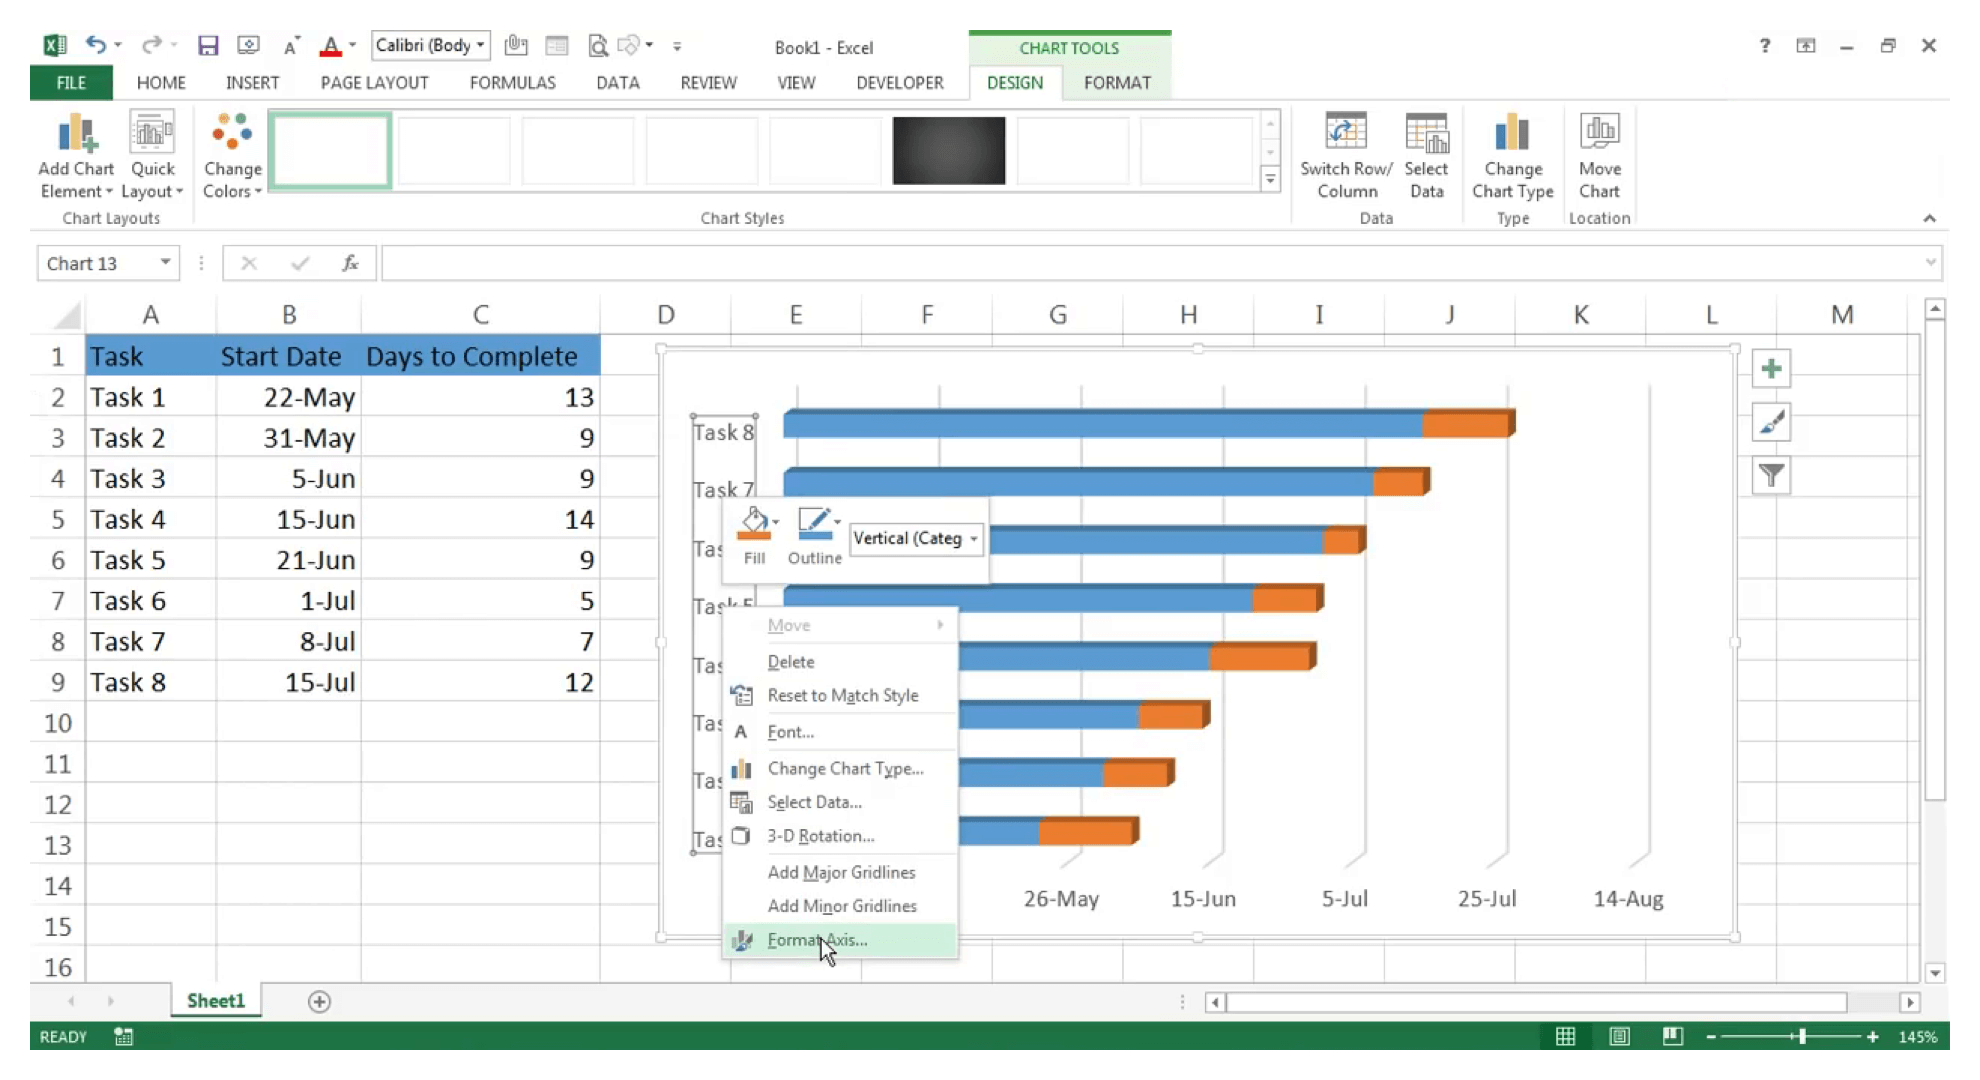
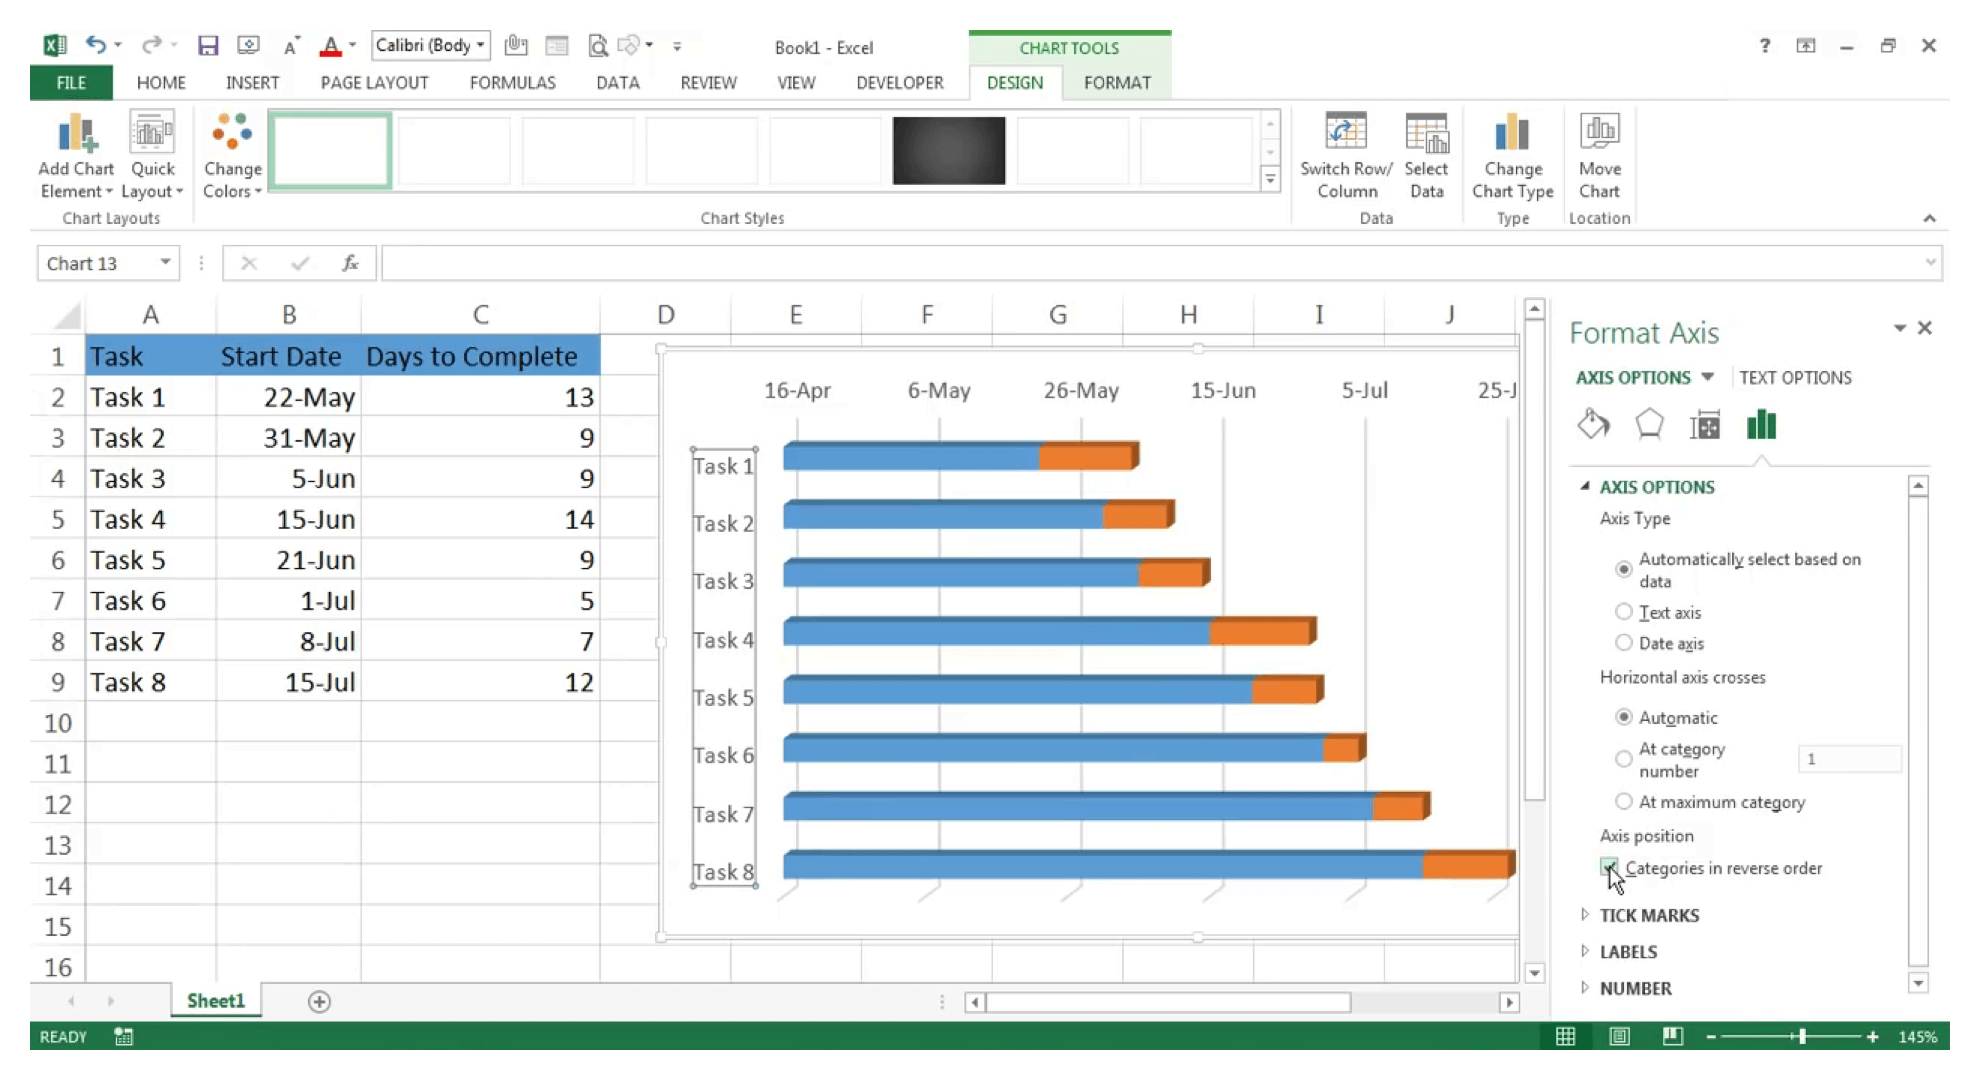
Step 16: Reverse the order of tasks To reverse the order of the tasks so that it looks like a Gantt chart, click on the task names on the chart, right click and in the context menu that appears, select Format Axis.
Step 17: Head to format axis The Format Axis pane will open. Click on Categories in reverse order check box. And close the format axis pane.
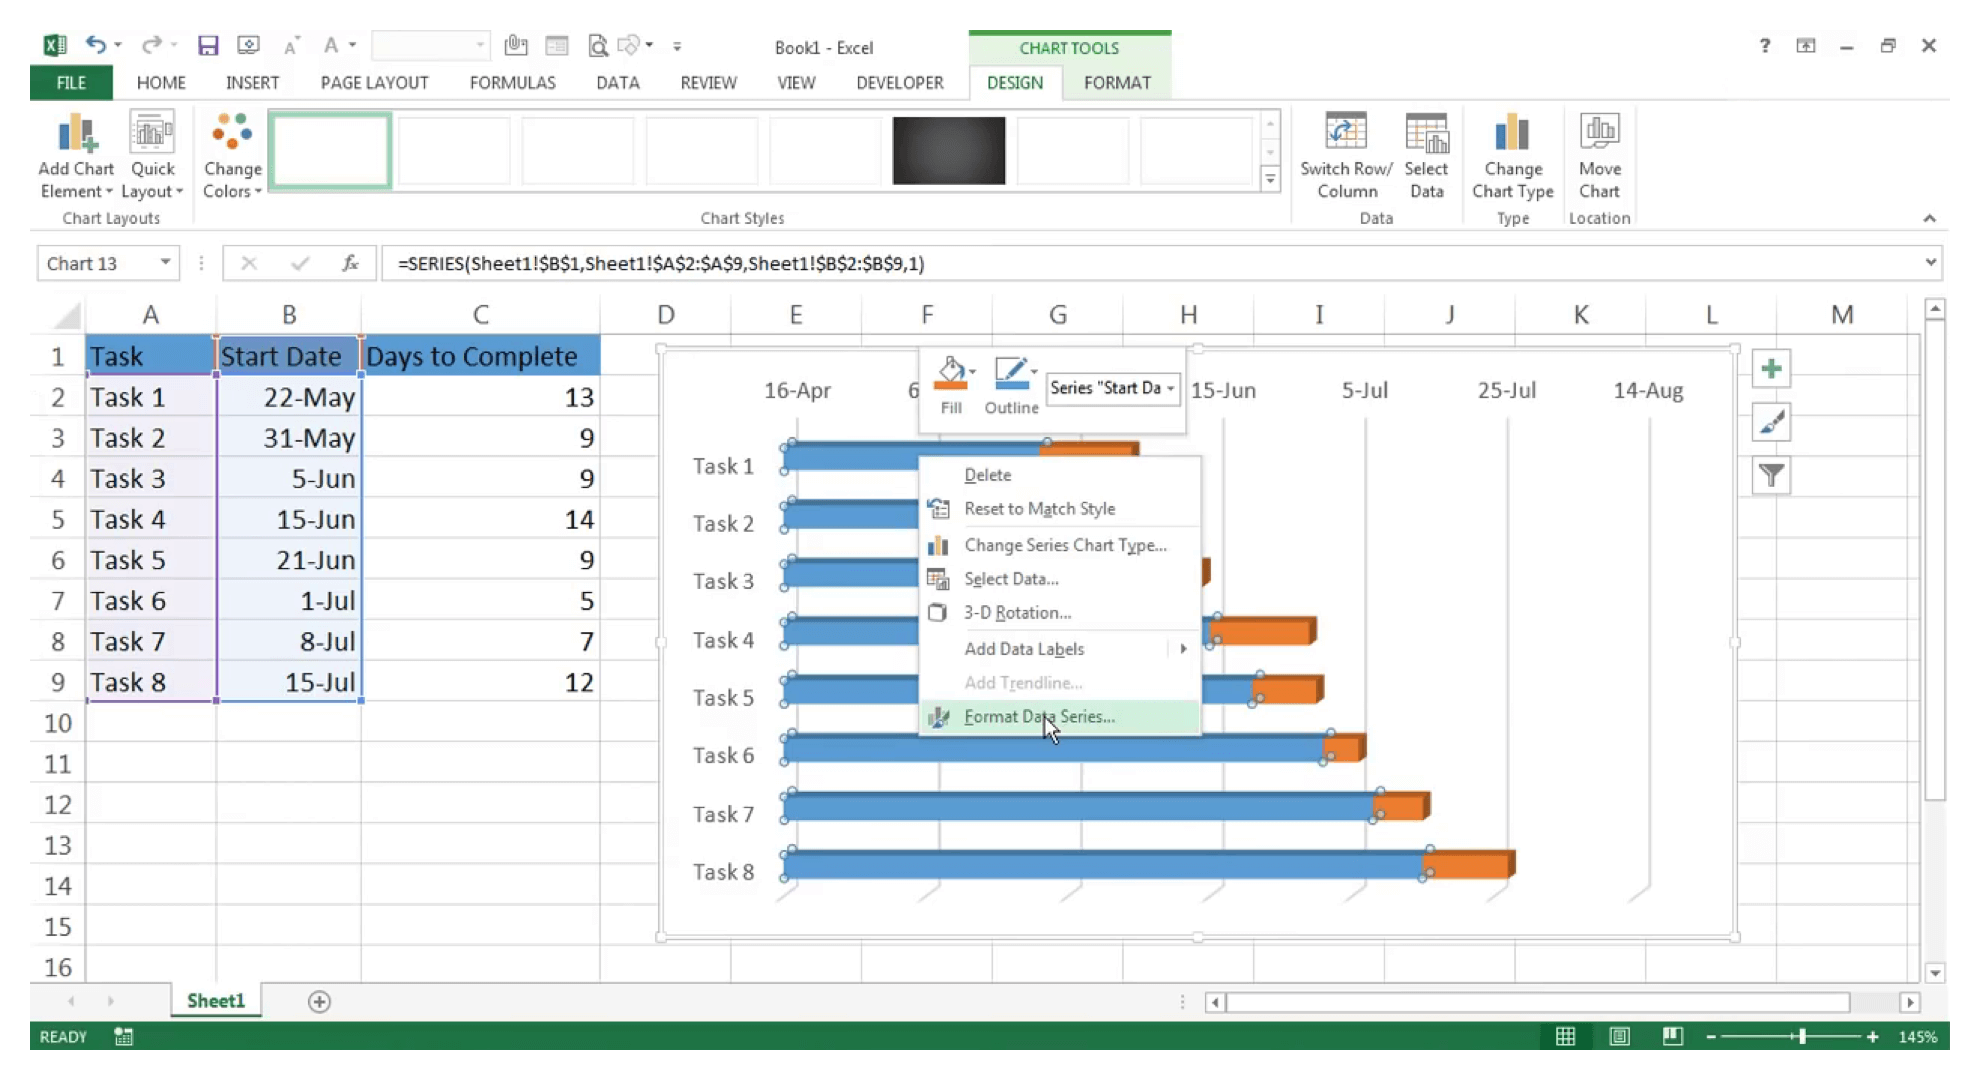
Step 18: Select format data series Next let's get rid of the bars that are made with the start date data (in the screenshot, they are the ones in blue). For this, right click on the bars as shown and select Format Data Series.
Step 19: Click on the paint bucket The Format Data Series pane will open. Here, select the paint bucket icon.
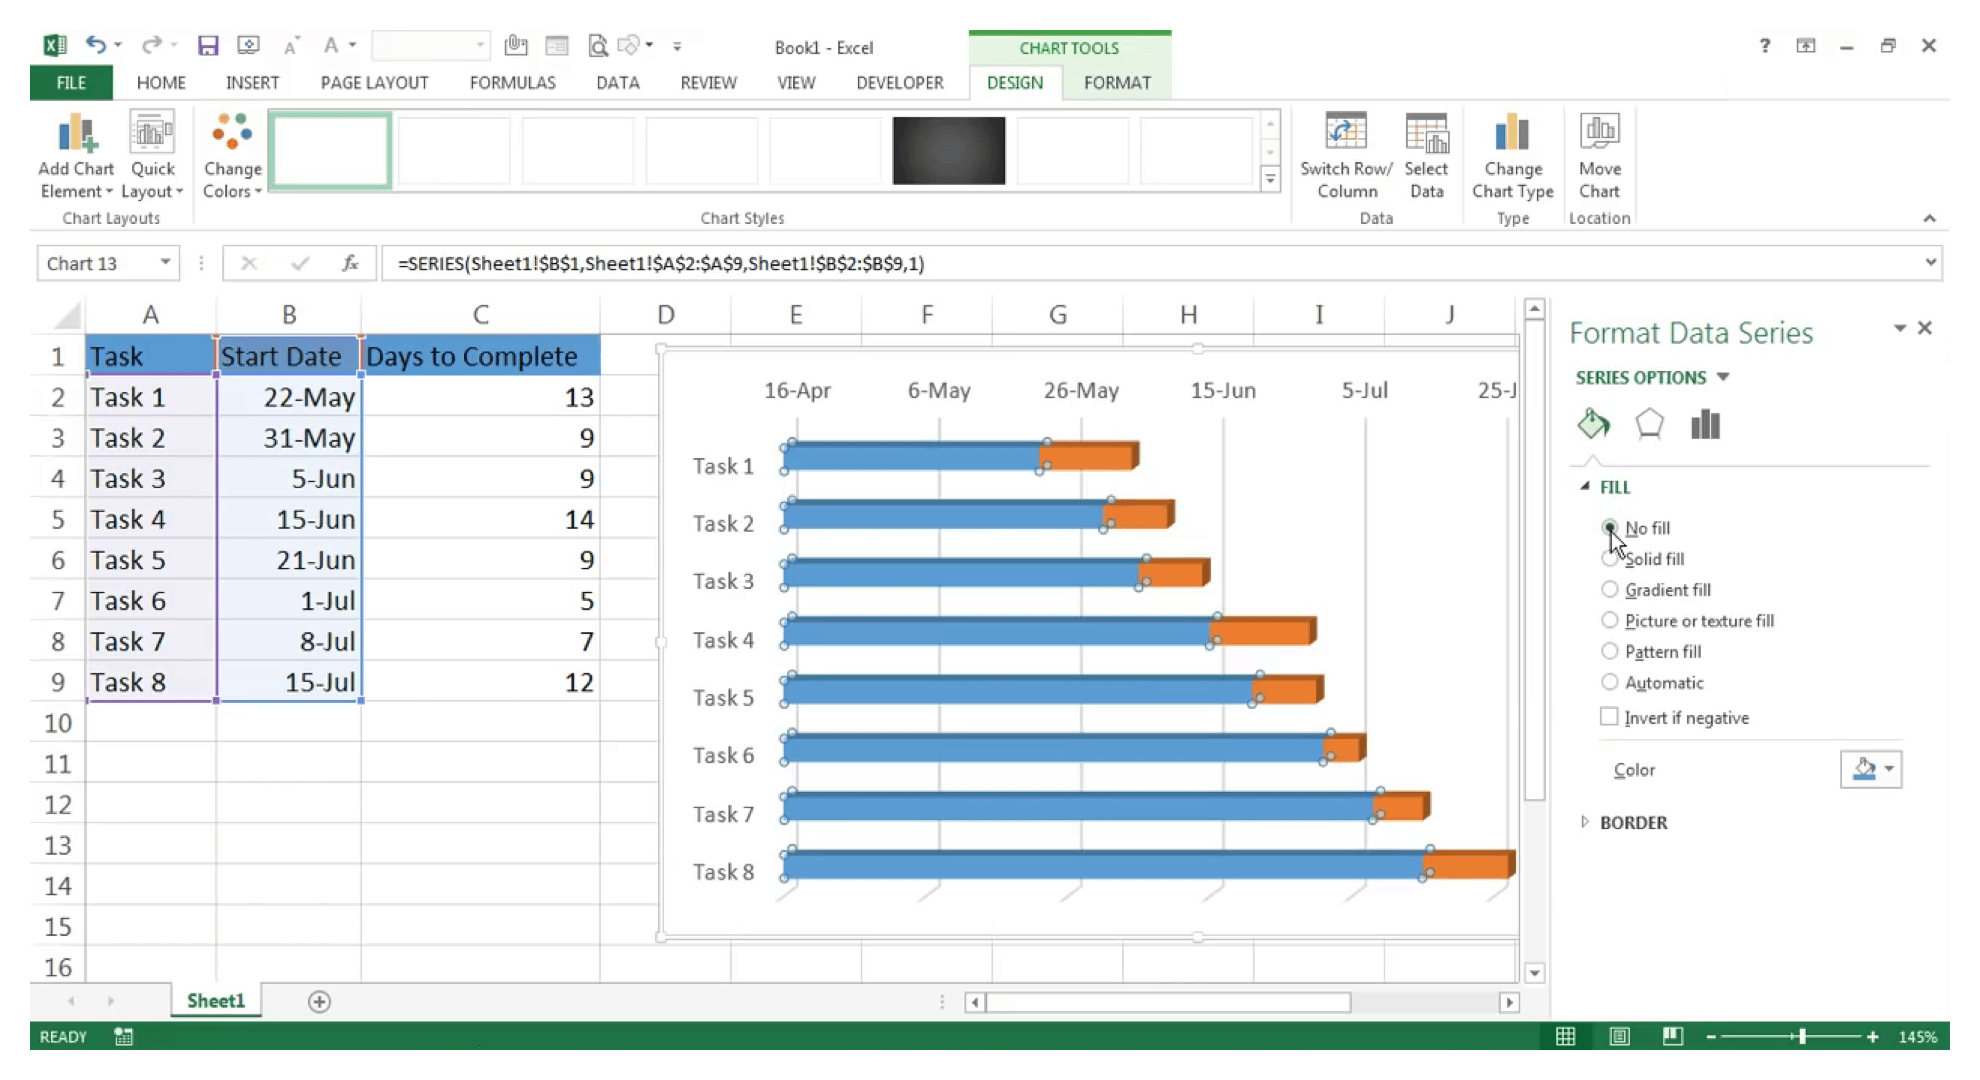
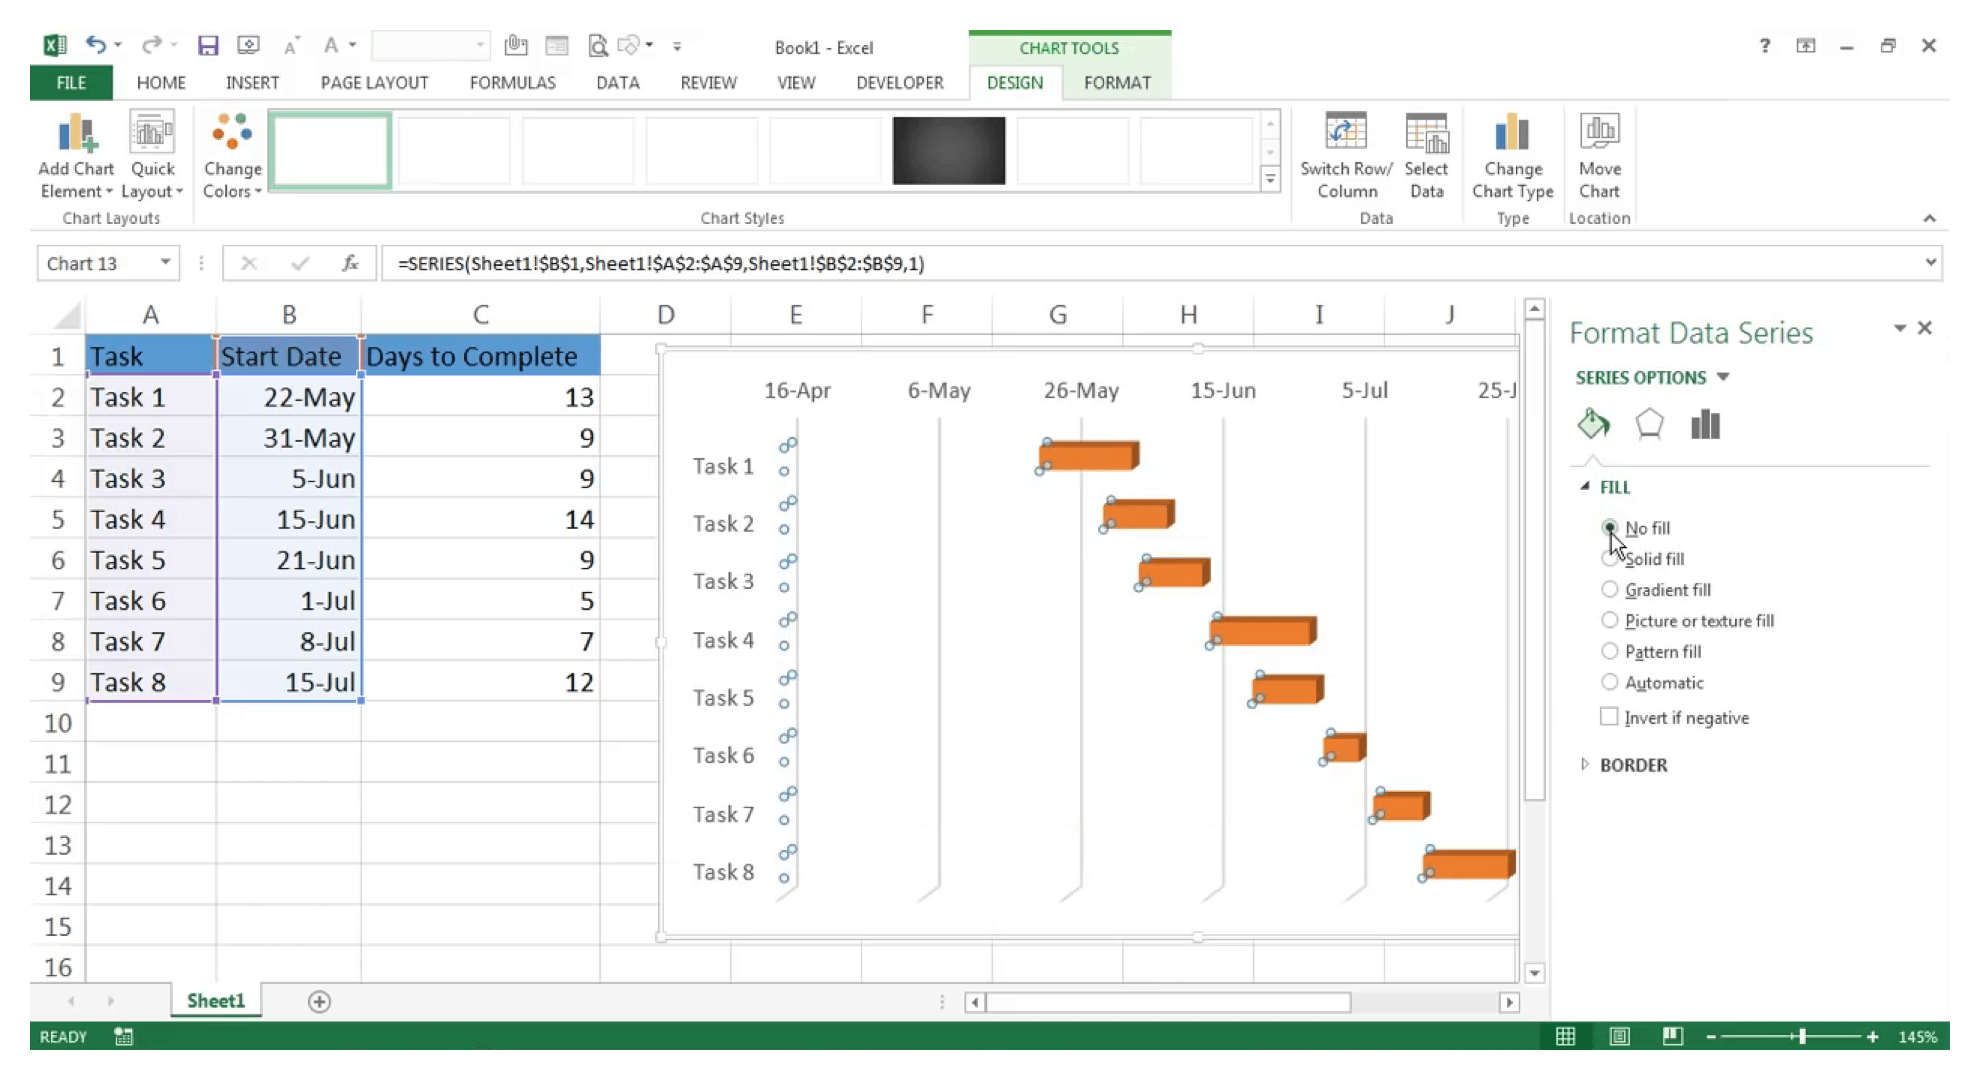
Step 20: Your Excel Gantt chart is ready Click on the No Fill option. Your Excel Gantt Chart is now complete.
How to make a Gantt chart in Zoho Projects
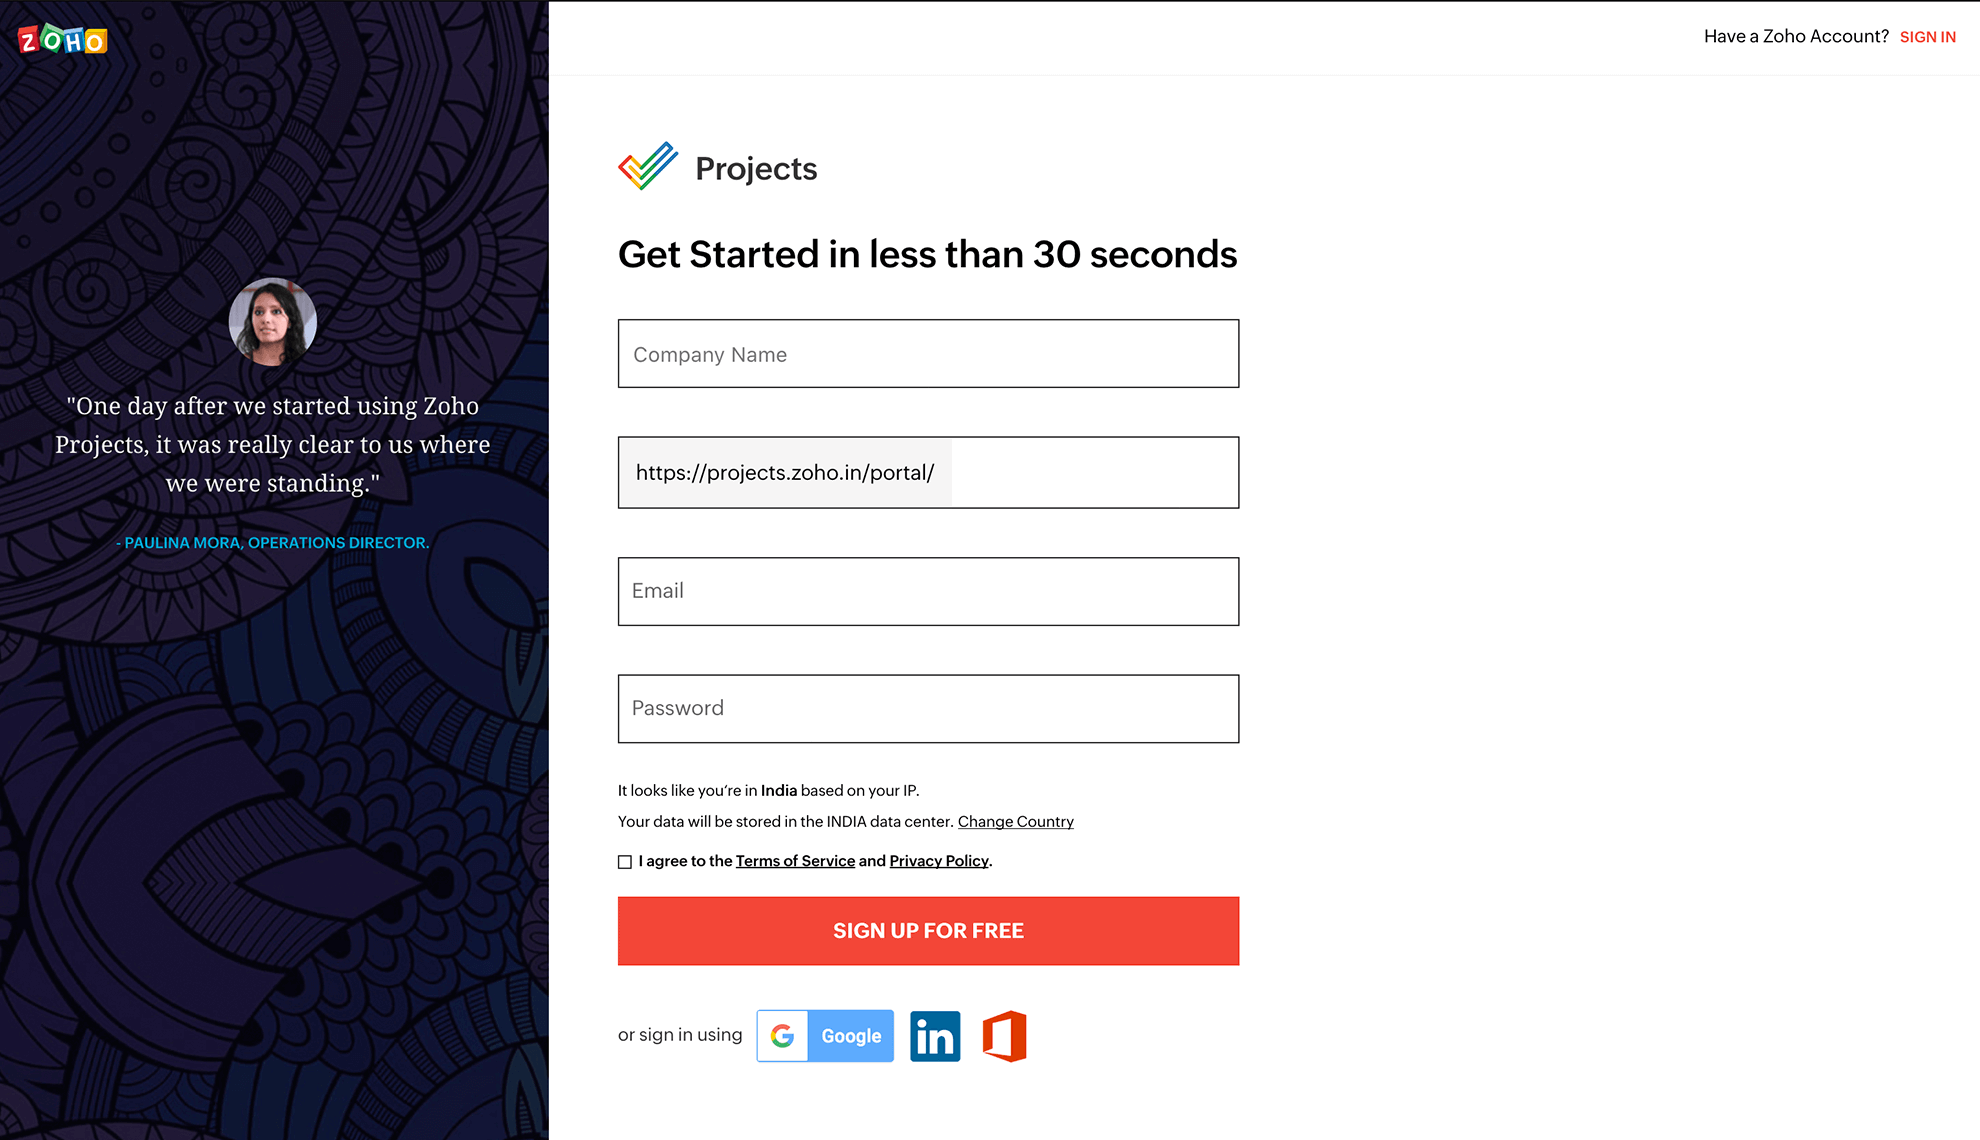
Step 01: Create your account Signup for a free account, and login to Zoho Projects
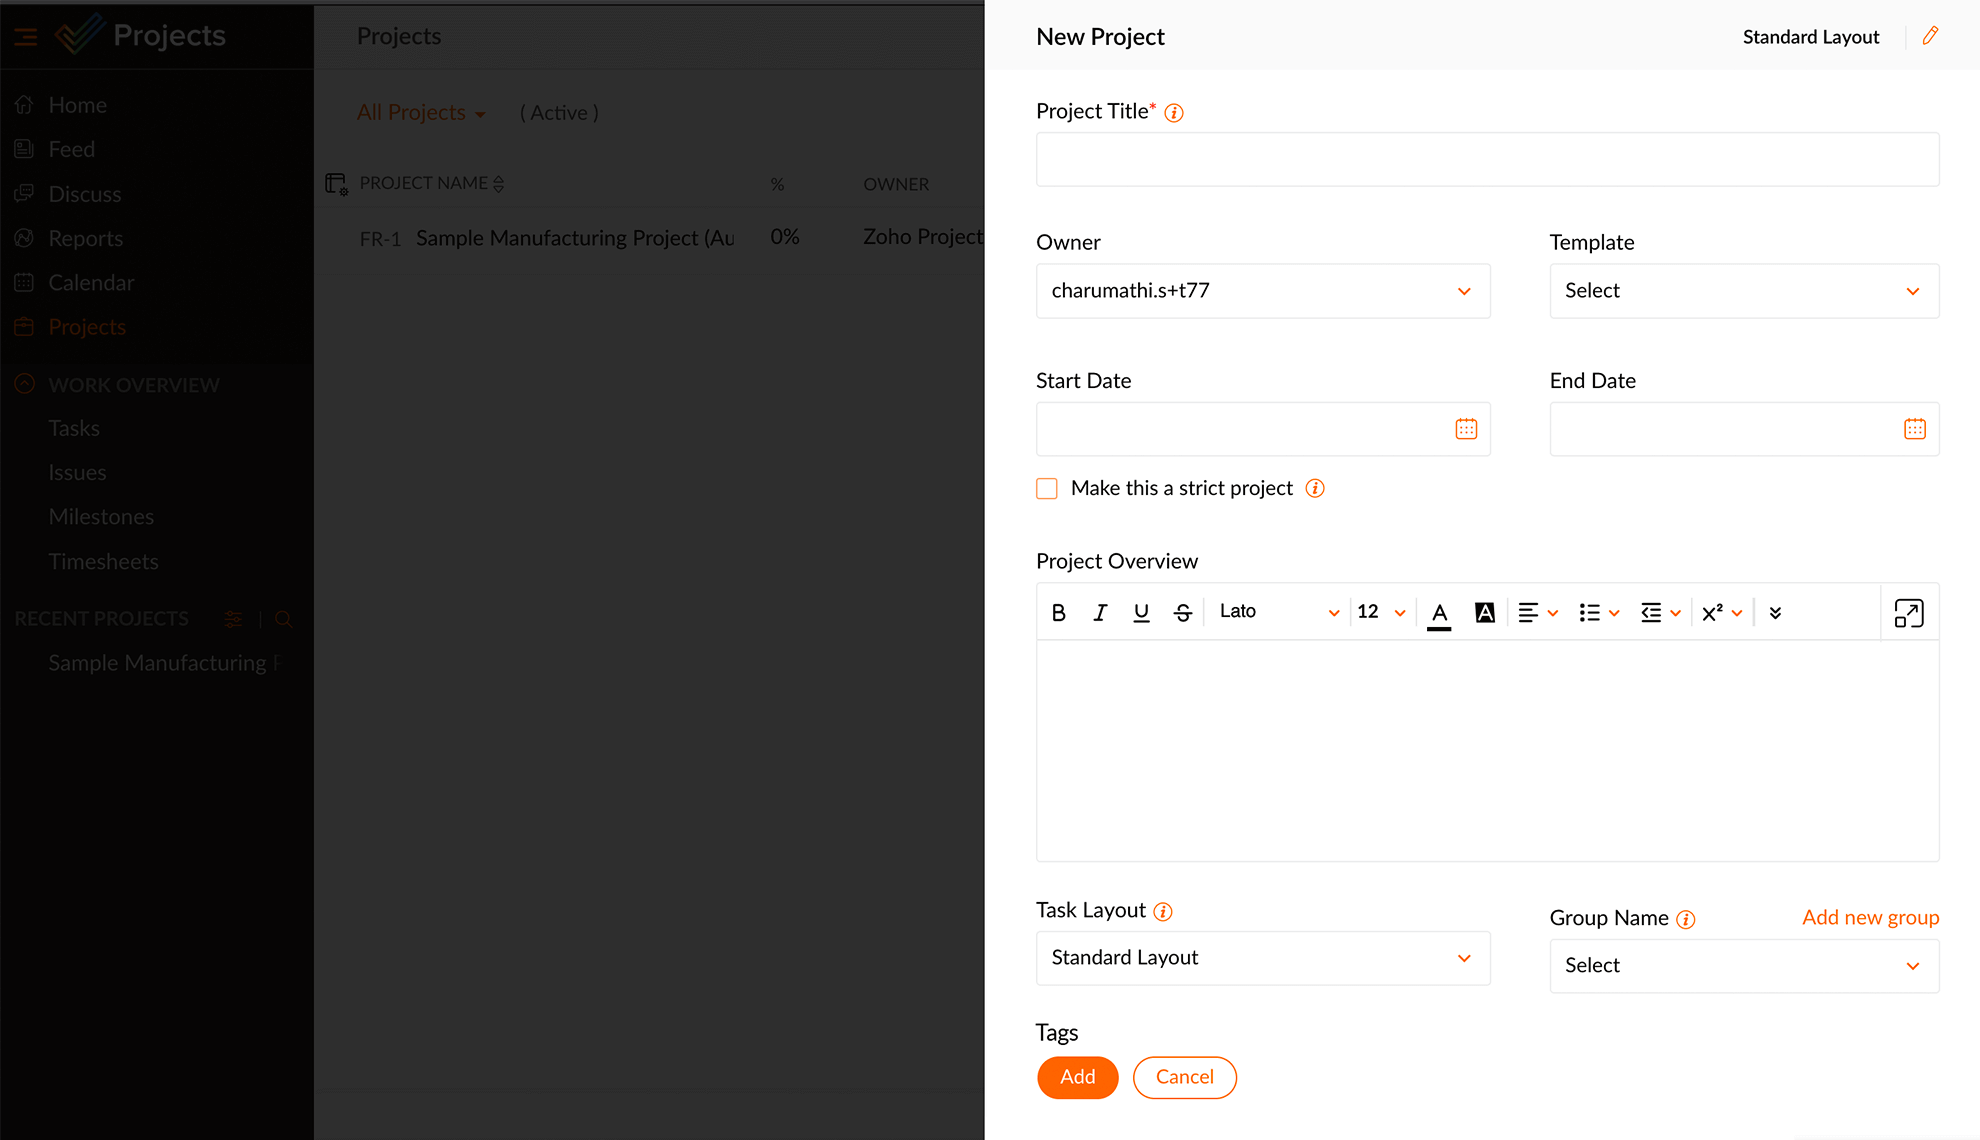
Step 02: Create a new project Click on the + button on the top bar, create a new project - enter the name of the project, click Add
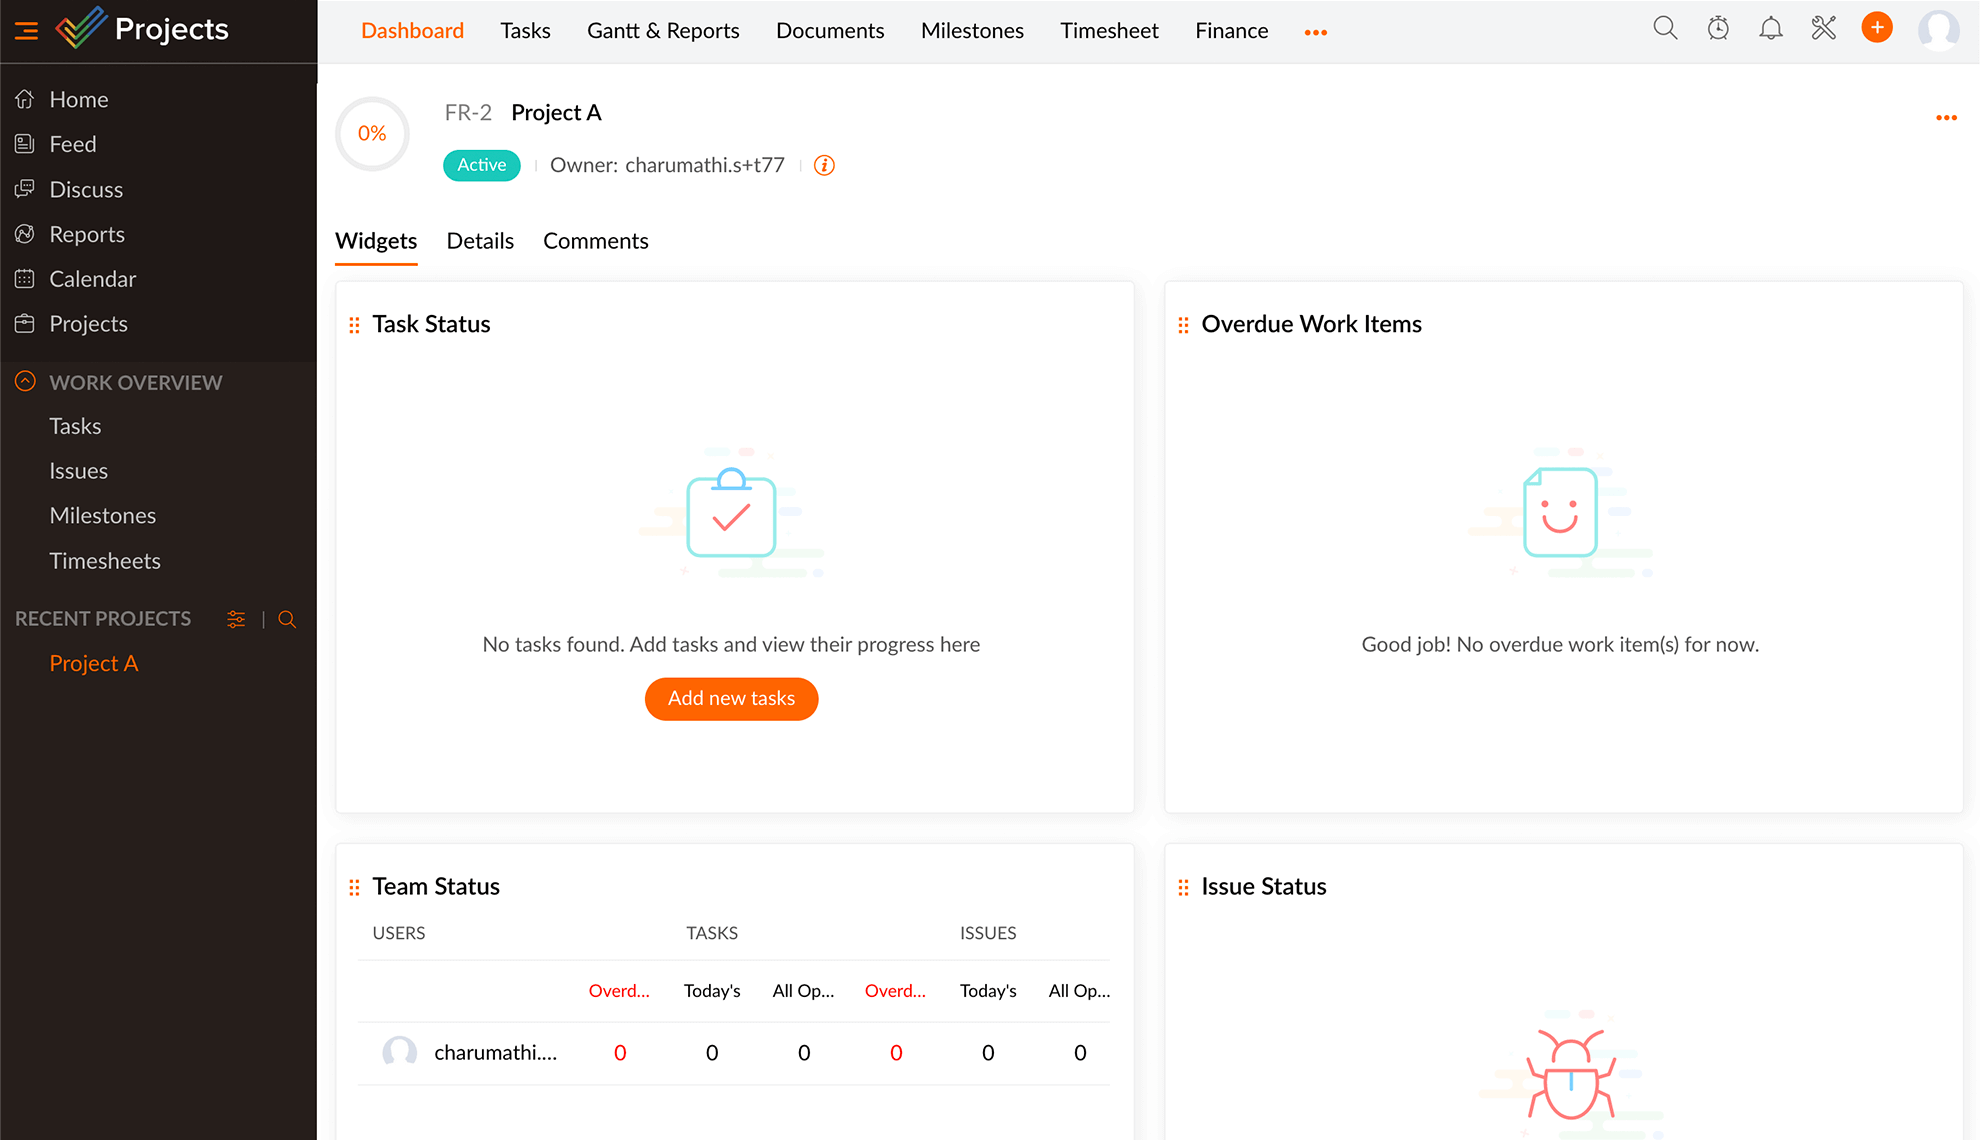
Step 03: Click on the + icon Once you're inside the project, click on + button again
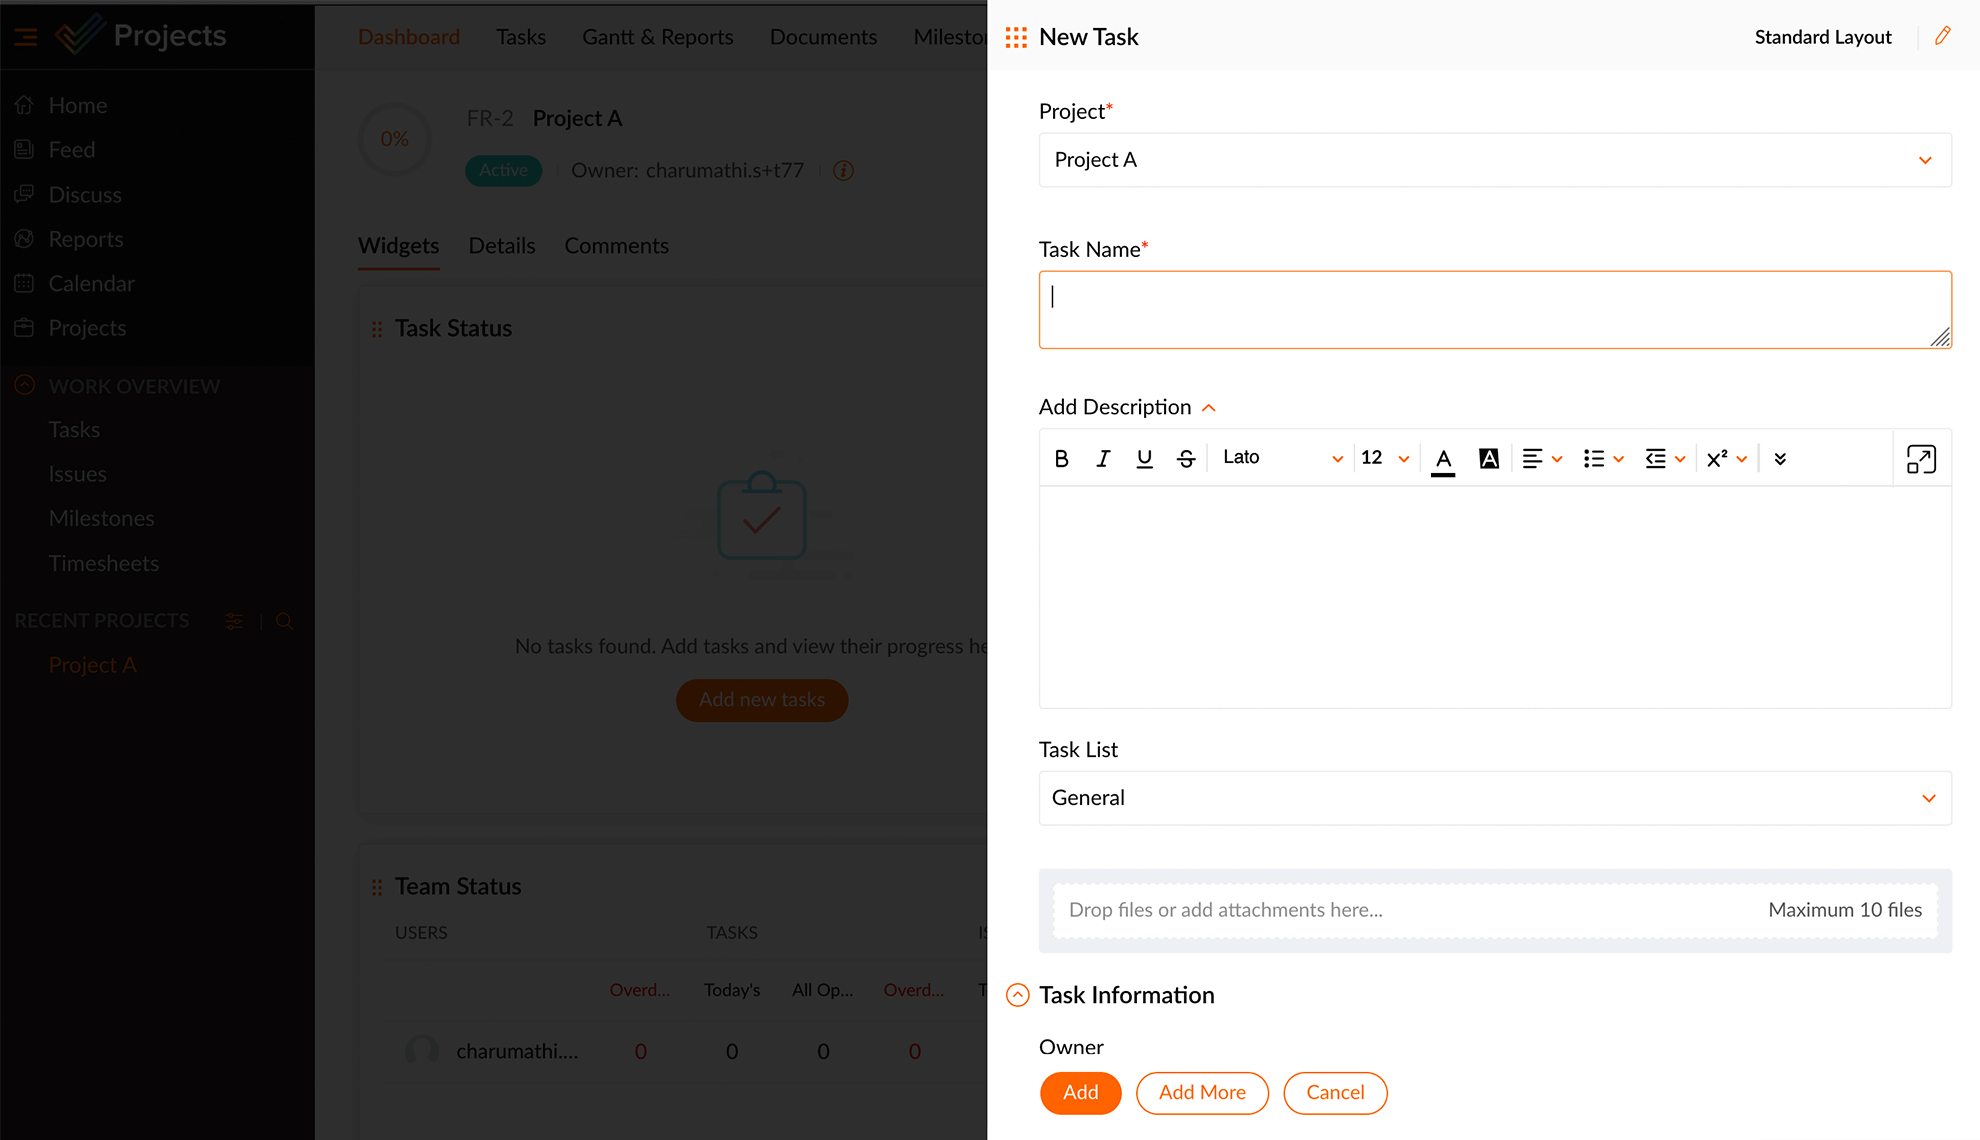
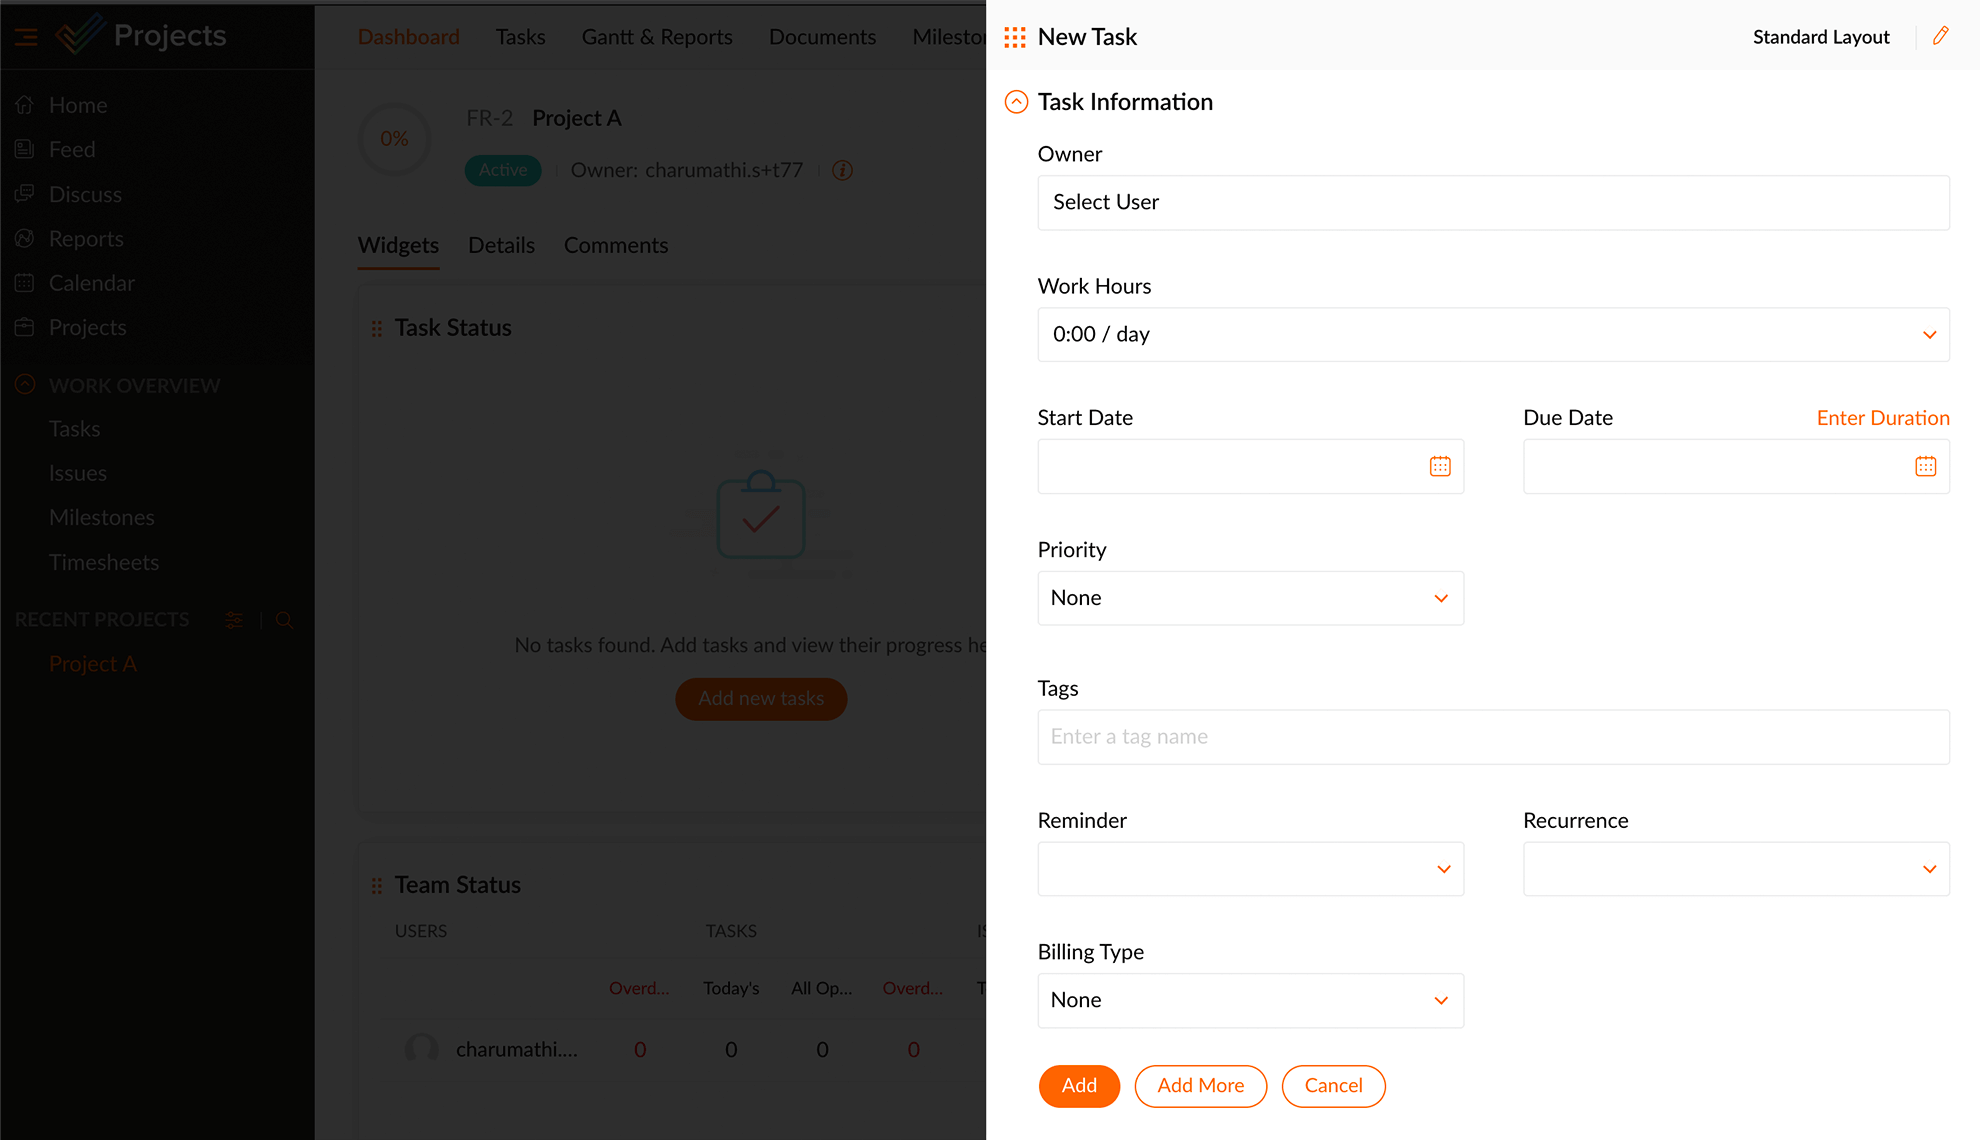
Step 04: Create a new task Click on Task and enter the details,
Click on Task and enter the details,
Owner - who will handle the task
Dates - the opening and closing dates/duration in days
Step 05: Add more tasks Click on Add more button after entering the task details to add more tasks and their details
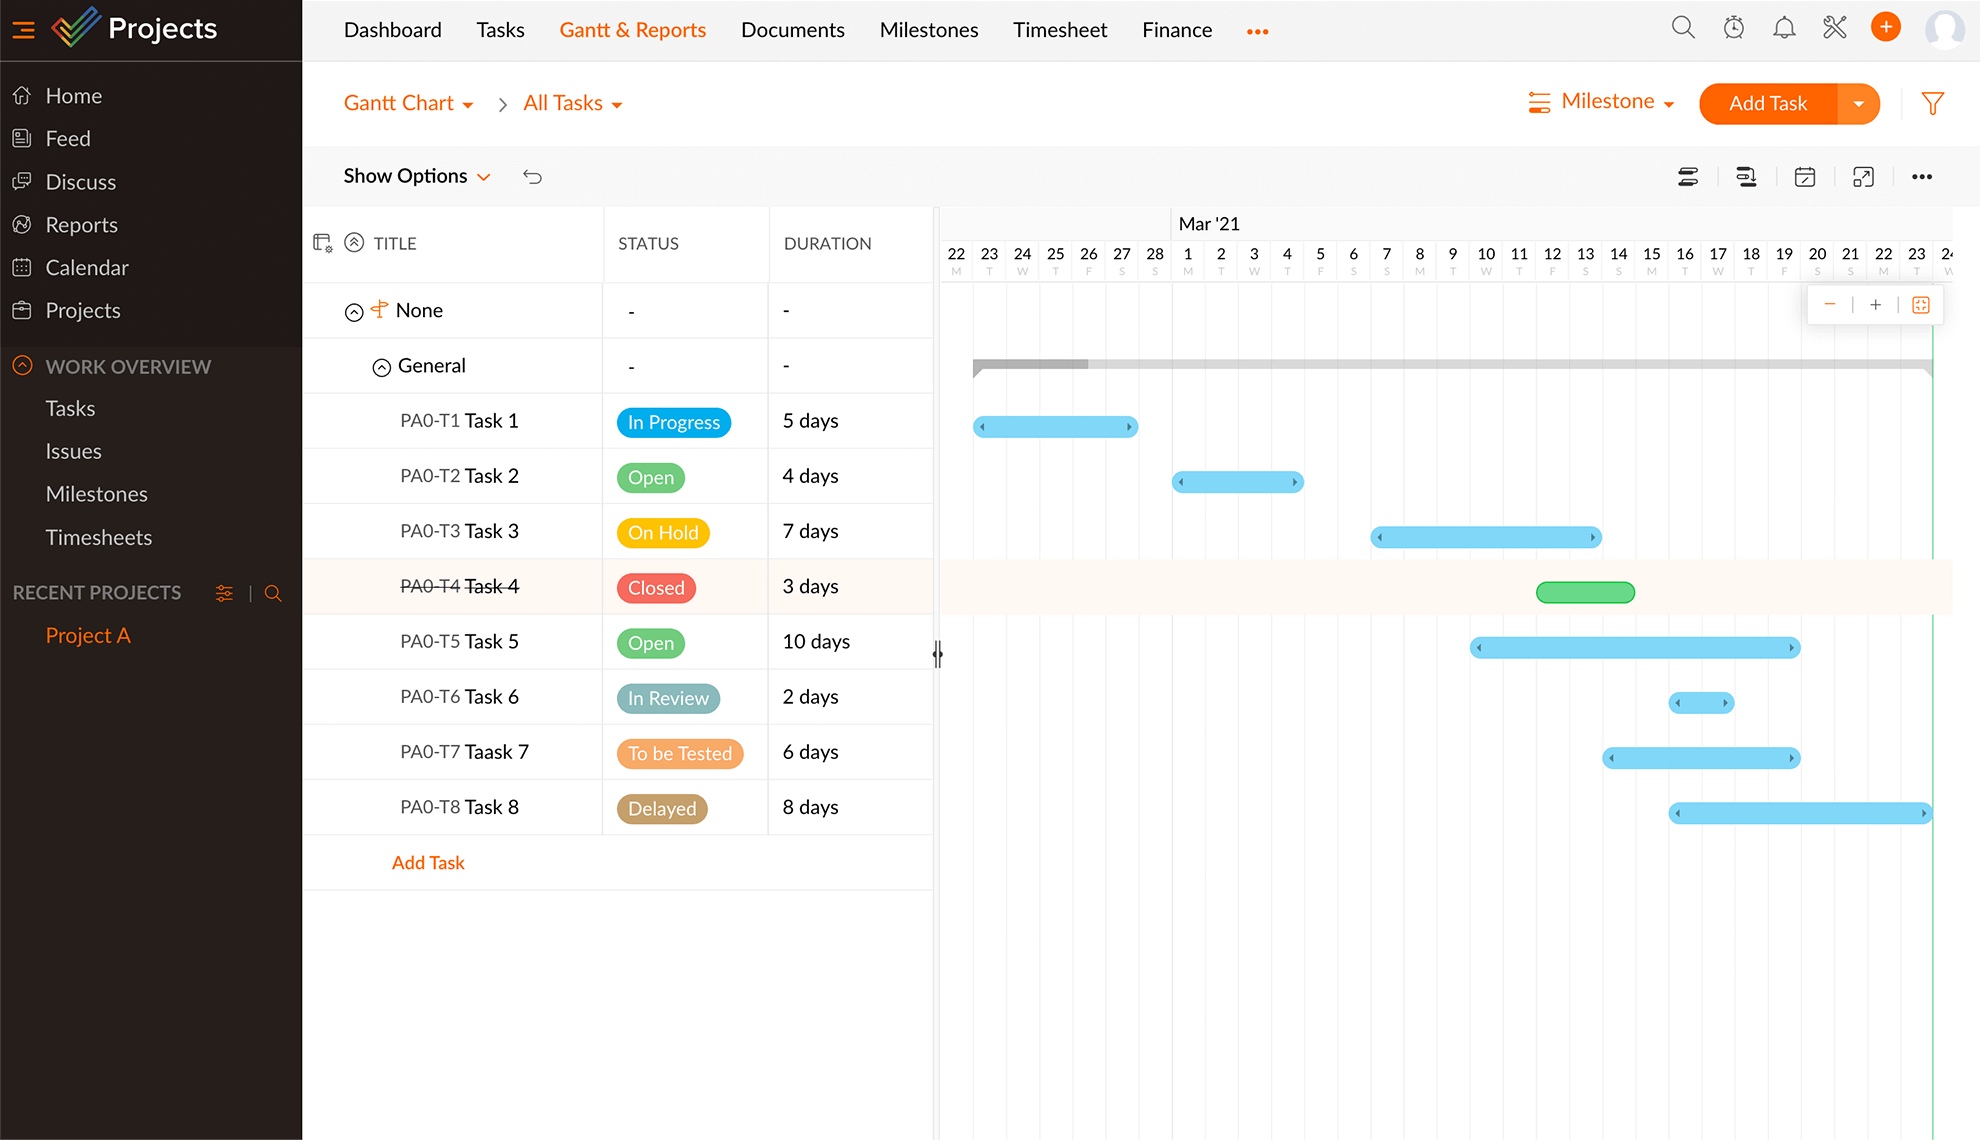
Step 06: Click on Gantt & Reports After entering all tasks and tasks' details, go to Gantt & Reports
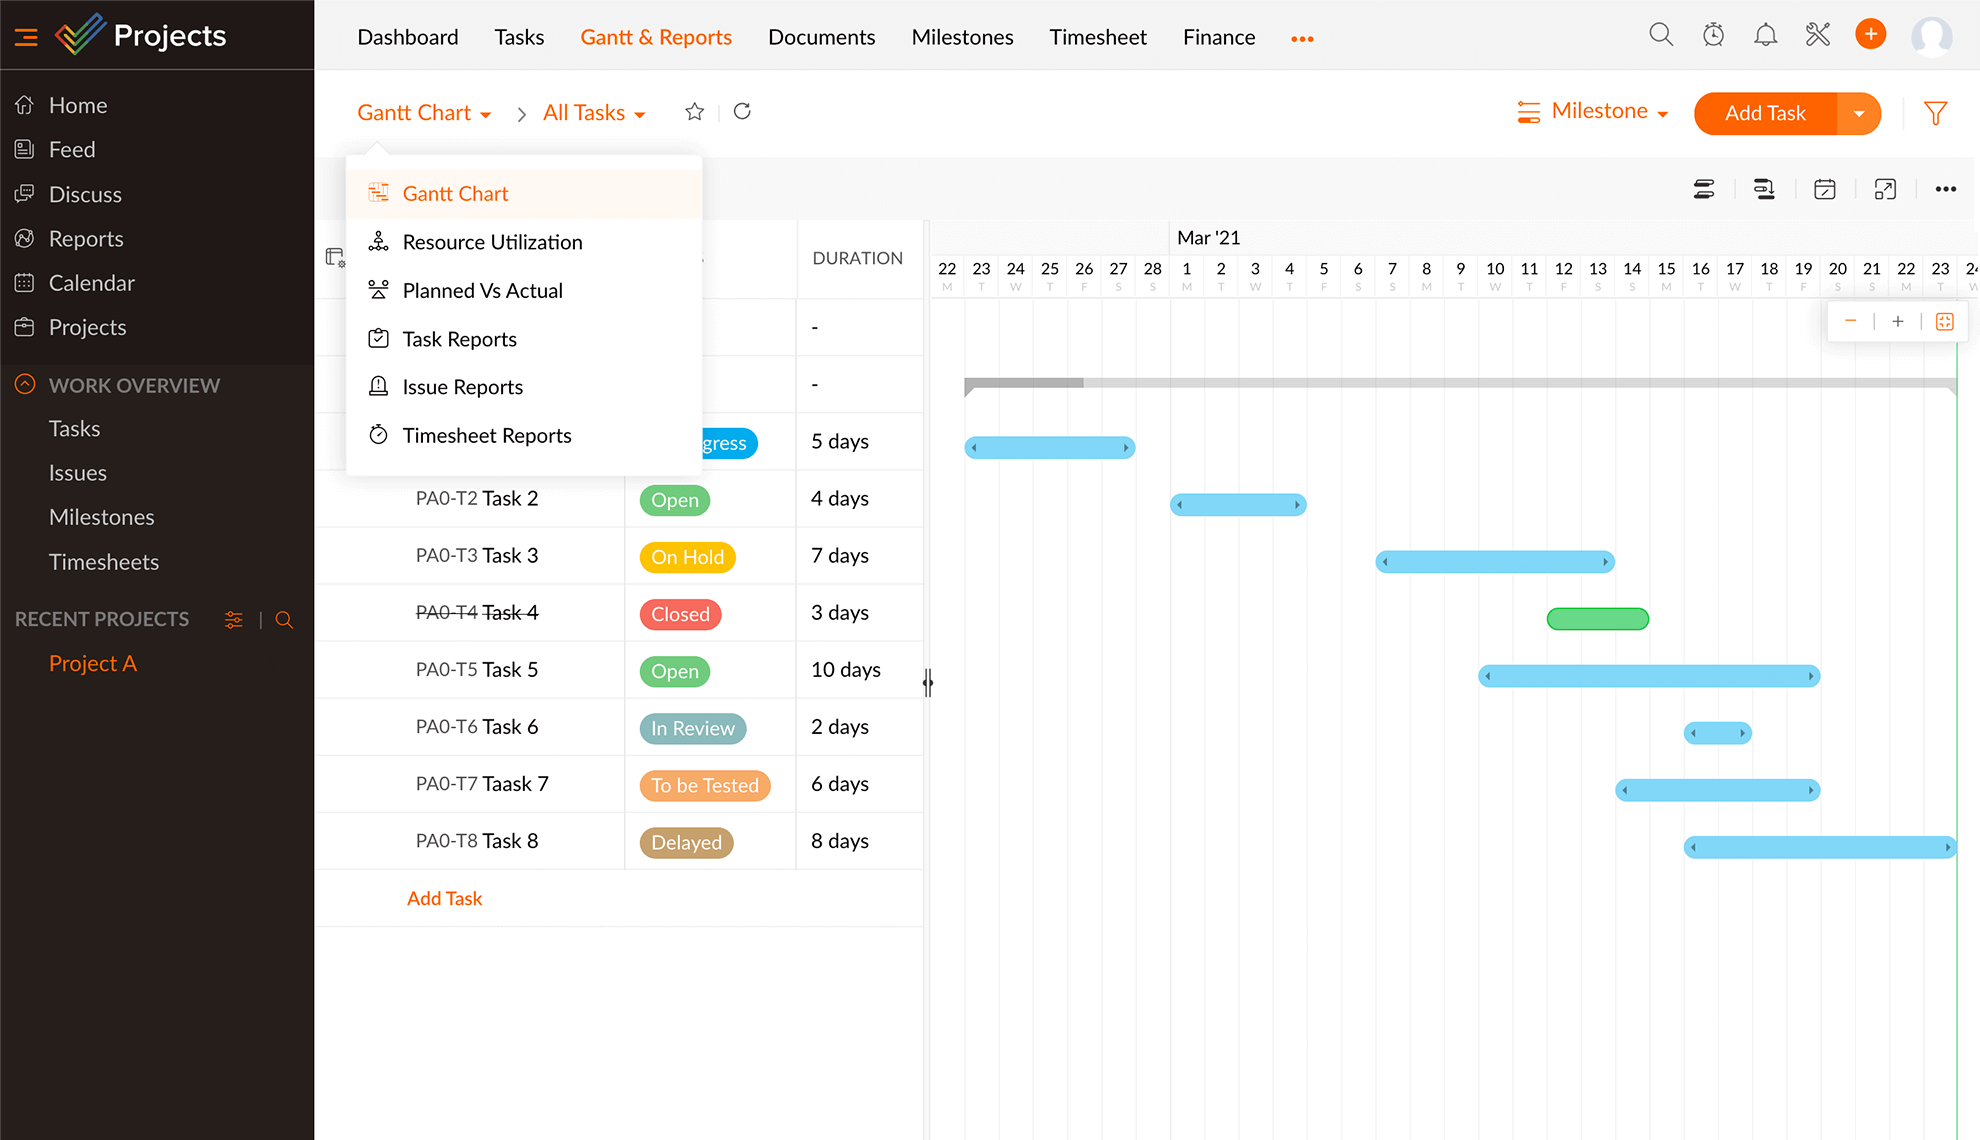
Step 07: Create your Gantt Chart Select Gantt charts - Your Gantt chart is ready. Print it, share it and get the ball rolling!
Limitations of creating Gantt charts in Excel
- Good for a small project with a limited number of tasks. Fitting the chart within a screen may become difficult for large projects.
- Excel Gantt charts with dependencies are hard to represent within the chart. It gets even more complicated if changes are made to the dates while planning.
- Project members cannot work simultaneously to populate tasks in the sheet.
- You are restricted to one view with Gantt charts in Excel.
Alternatives to Excel
Kanban
Moving cards from one board to another to represent work completion is as satisfying as crossing a work item off a to-do list. For teams with ever-changing workflows, Kanban boards help with visualization, enabling your teams to communicate on the fly and make instant changes to avoid slip-ups. These boards allow multiple collaborators to work on the same activity simultaneously.
Scrum
Scrum boards focus on a chunk of deliverables as opposed to a full-blown project, visualizing all your tasks belonging to one project, in one place. Easily customizable and flexible, Scrum boards keep you up to date on your tasks, allowing you to keep track of your workflows in the form of well-organized sprints in chronological order.
Dashboards
Personalized dashboards that reflect your data in real time keep you on top of all your project-related endeavors. Whether it's the top performing employees or the number of resolved bugs, be certain that your stakeholders are kept informed about all crucial developments.
Gantt charts
A visual depiction of projects with bars plotted against the project timeline, the Gantt chart paints your projects in the most colorful way possible. Set dependencies between any two tasks of relevance, calculate the actual progress of your project, and highlight critical tasks. Check out Zoho Projects Gantt charts for a simple, no-nonsense approach.
Task lists
It doesn't get easier than neatly listing all your tasks and going back to them whenever you want. For people who enjoy the simple things, a task list would suffice, while tools that come with a steep learning curve are shown the door. Particulars like status, priority, start and end date, and more can be arranged and rearranged in order of preference. And when you're in need of new, unique columns that fit your business goals, you can customize an endless number of them. Sample it in Zoho Projects.
Why should you choose Zoho Projects over Excel for creating Gantt charts?
Plan together
One of the best things about making Gantt charts in Zoho Projects is that you can plan together in real time. So, even if you need to change the timeline , you can change it in a few seconds and see what it looks like right away. You can even @mention your team mates inside Zoho Projects. And there's built-in chat, too.
Dynamic context
Gantt charts in Zoho Projects are dynamic and adaptive. You can see who's working on the chart, and how far along the project is. With the intuitive color coding system, you get to see which tasks are complete, in progress, or overdue. Clicking on a task gives you more details, and you can leave a comment right inside the Details pane.
Link tasks with dependencies
Some tasks are connected. Some need to be done at the same time, while others need to be completed in a particular order. Map them all visually with four types of task dependencies in Zoho Projects. Click, drag, and done.
Analyze and adapt
The project baseline gives you an "expectation vs. reality" view of your timeline. The critical path tells you the tasks you need to prioritize to complete a project. Slack shows you the amount of buffer time you have in your timeline. With these tools, you can revisit your project plan, allocate resources effectively, all while saving time and money.
Easy to use
No more digging through menus to find that one hidden button. In Zoho Projects, all options and tools are within your reach. And of course, help is always at hand with live 24/5 support right inside the software. You can also easily import XLS tasks in bulk and view your Gantt chart in an instant!
Benefits of using Excel
Creating a Gantt chart in Excel might involve multiple, time-consuming steps, but there are a number of benefits. Here's what you can do with an Excel Gantt chart:
Store data
A colossal amount of data can be stored within Microsoft Excel's grid format in the form of tables, charts, and more. Not only that, you can also analyze and sort data based on a number of criteria. From simple grocery lists to complex commutative data, the grid can house it all.
Calculate data
Popular for its powerful calculation capabilities, Excel is extensively utilized by students and businesses alike to make advanced statistical or mathematical calculations with the host of integrated formulae and integrations, ramping up data accuracy and saving you a ton of manual effort.
Visualize data
Stack your data up in a bar chart or break it down in a pie chart—with various visually-appealing ways to display your data in Excel, boring numbers get a face-lift.
Secure your data
Protect sensitive data and restrict unauthorized access with encryption, password protection, and access permissions.
Increased efficiency
Laden with integrative capabilities, customization tools, and collaborative features, Microsoft Excel takes efficiency and productivity up a notch.
Why is online Gantt chart software better than Excel?
Microsoft Excel is synonymous with the project management world, given its impeccable data visualization capabilities. Creating a Gantt chart in Excel has its benefits, but none of these can compare to the perks of Gantt chart software. Here's why online Gantt chart software is better than Microsoft Excel.
Set dependencies
With a Gantt chart at hand, you can link relevant tasks and create dependencies. Zoho Projects offers four different types of dependencies: Finish to Start, Finish to Finish, Start to Finish, and Start to Start. Calculate and make adjustments to the time lag to fit with your dynamic schedule.
Identify the critical path
A critical path is the longest stretch of dependent activities whose completion profoundly impacts the project as a whole. An online Gantt chart software singles out such tasks and ensures you complete them before it's too late.
Real-time insights
Any shift in dates or change in project duration is directly reflected in online Gantt chart software, empowering project managers to make informed decisions. What's more, Gantt bars can be resized or moved to fit any kind of ad-hoc change. The Baseline feature paints you a picture of your actual progress versus where you started. You can also draw a comparison between two dissimilar baselines.
Increased visibility
With an ever-changing project schedule, it can get quite difficult to keep abreast of intrinsic developments. Gantt charts deconstruct your project into milestones, task lists, tasks, and subtasks, displaying real-time updates of each work item in sheer detail, keeping you and your team on the same page.
Over 5 million people
across the globe trust us. You should too.