What Is Embedded Reporting?
Embedded reporting is the practice of integrating reports, dashboards, and AI-assisted reporting features into a business application so users can view and interact with data without leaving the product. The reporting experience is built into the application's interface and follows the same navigation, branding, and access controls as the rest of the software.
For users, this means reporting becomes part of their everyday tasks rather than a separate activity. Instead of exporting data or opening another BI tool to answer a question, they can access the information they need from the same application where the data is created and managed.
Embedded reporting is one component of embedded analytics. While embedded analytics includes capabilities such as data preparation, semantic modeling, advanced analysis, and predictive insights, embedded reporting focuses specifically on presenting information through reports, dashboards, and other interactive reporting experiences.
Embedded reporting tool vs. standalone reporting tool
| Feature | Embedded Reporting Tool | Standalone Reporting Tool |
|---|---|---|
| User experience | Reports are accessed from within the host application. | Users leave the application to access a separate reporting platform. |
| Access to insights | Information is available where business activities take place. | Users typically switch applications before they can analyze data. |
| User adoption | Reporting is easier to adopt because it is part of the existing product experience. | Adoption depends on users learning and regularly accessing a separate tool. |
| Branding | Reports and dashboards can be customized to match the application's look and feel. | Interface branding and styling are generally limited to the reporting vendor's capabilities. |
| Security and governance | Uses the application's authentication, authorization, and data access policies. | Security and permissions must be managed across a separate reporting environment. |
| Integration | Embedded once using APIs, SDKs, or iFrames and managed as part of the application. | Requires users to access another application or relies on separate data synchronization processes. |
| Business value | Reporting becomes a native product capability that enhances the overall user experience. | Reporting remains an external service that supports, rather than extends, the core application. |
How Is Embedded Reporting Used in Real Products?
Embedded reporting is valuable wherever a business application captures operational data that users need to understand and act on. Across industries, the pattern is the same: reporting appears alongside everyday tasks, allowing users to move from information to action without switching applications.
CRM and Sales Platforms
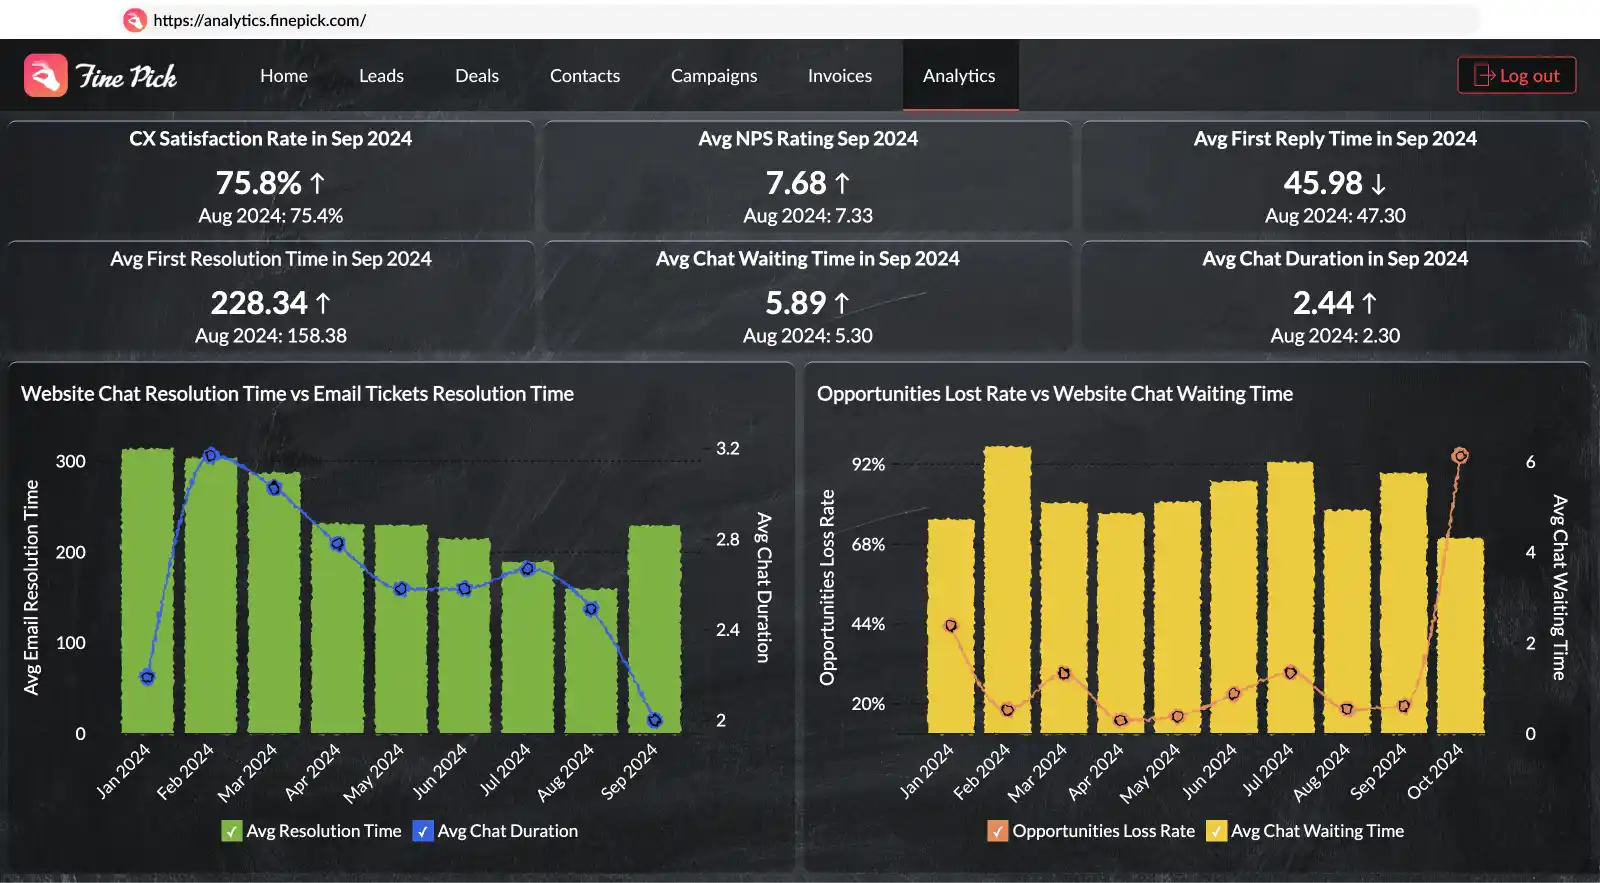
CRM applications embed reports that help sales teams monitor pipeline coverage, win rates, forecast accuracy, and quota attainment. A regional sales manager reviewing an account can open territory or representative performance reports directly from the customer record instead of exporting opportunity data. Because reports are connected to live CRM information, forecasts update automatically as deals progress through the pipeline (Know more about embedded analytics for sales).
Finance and Accounting Software
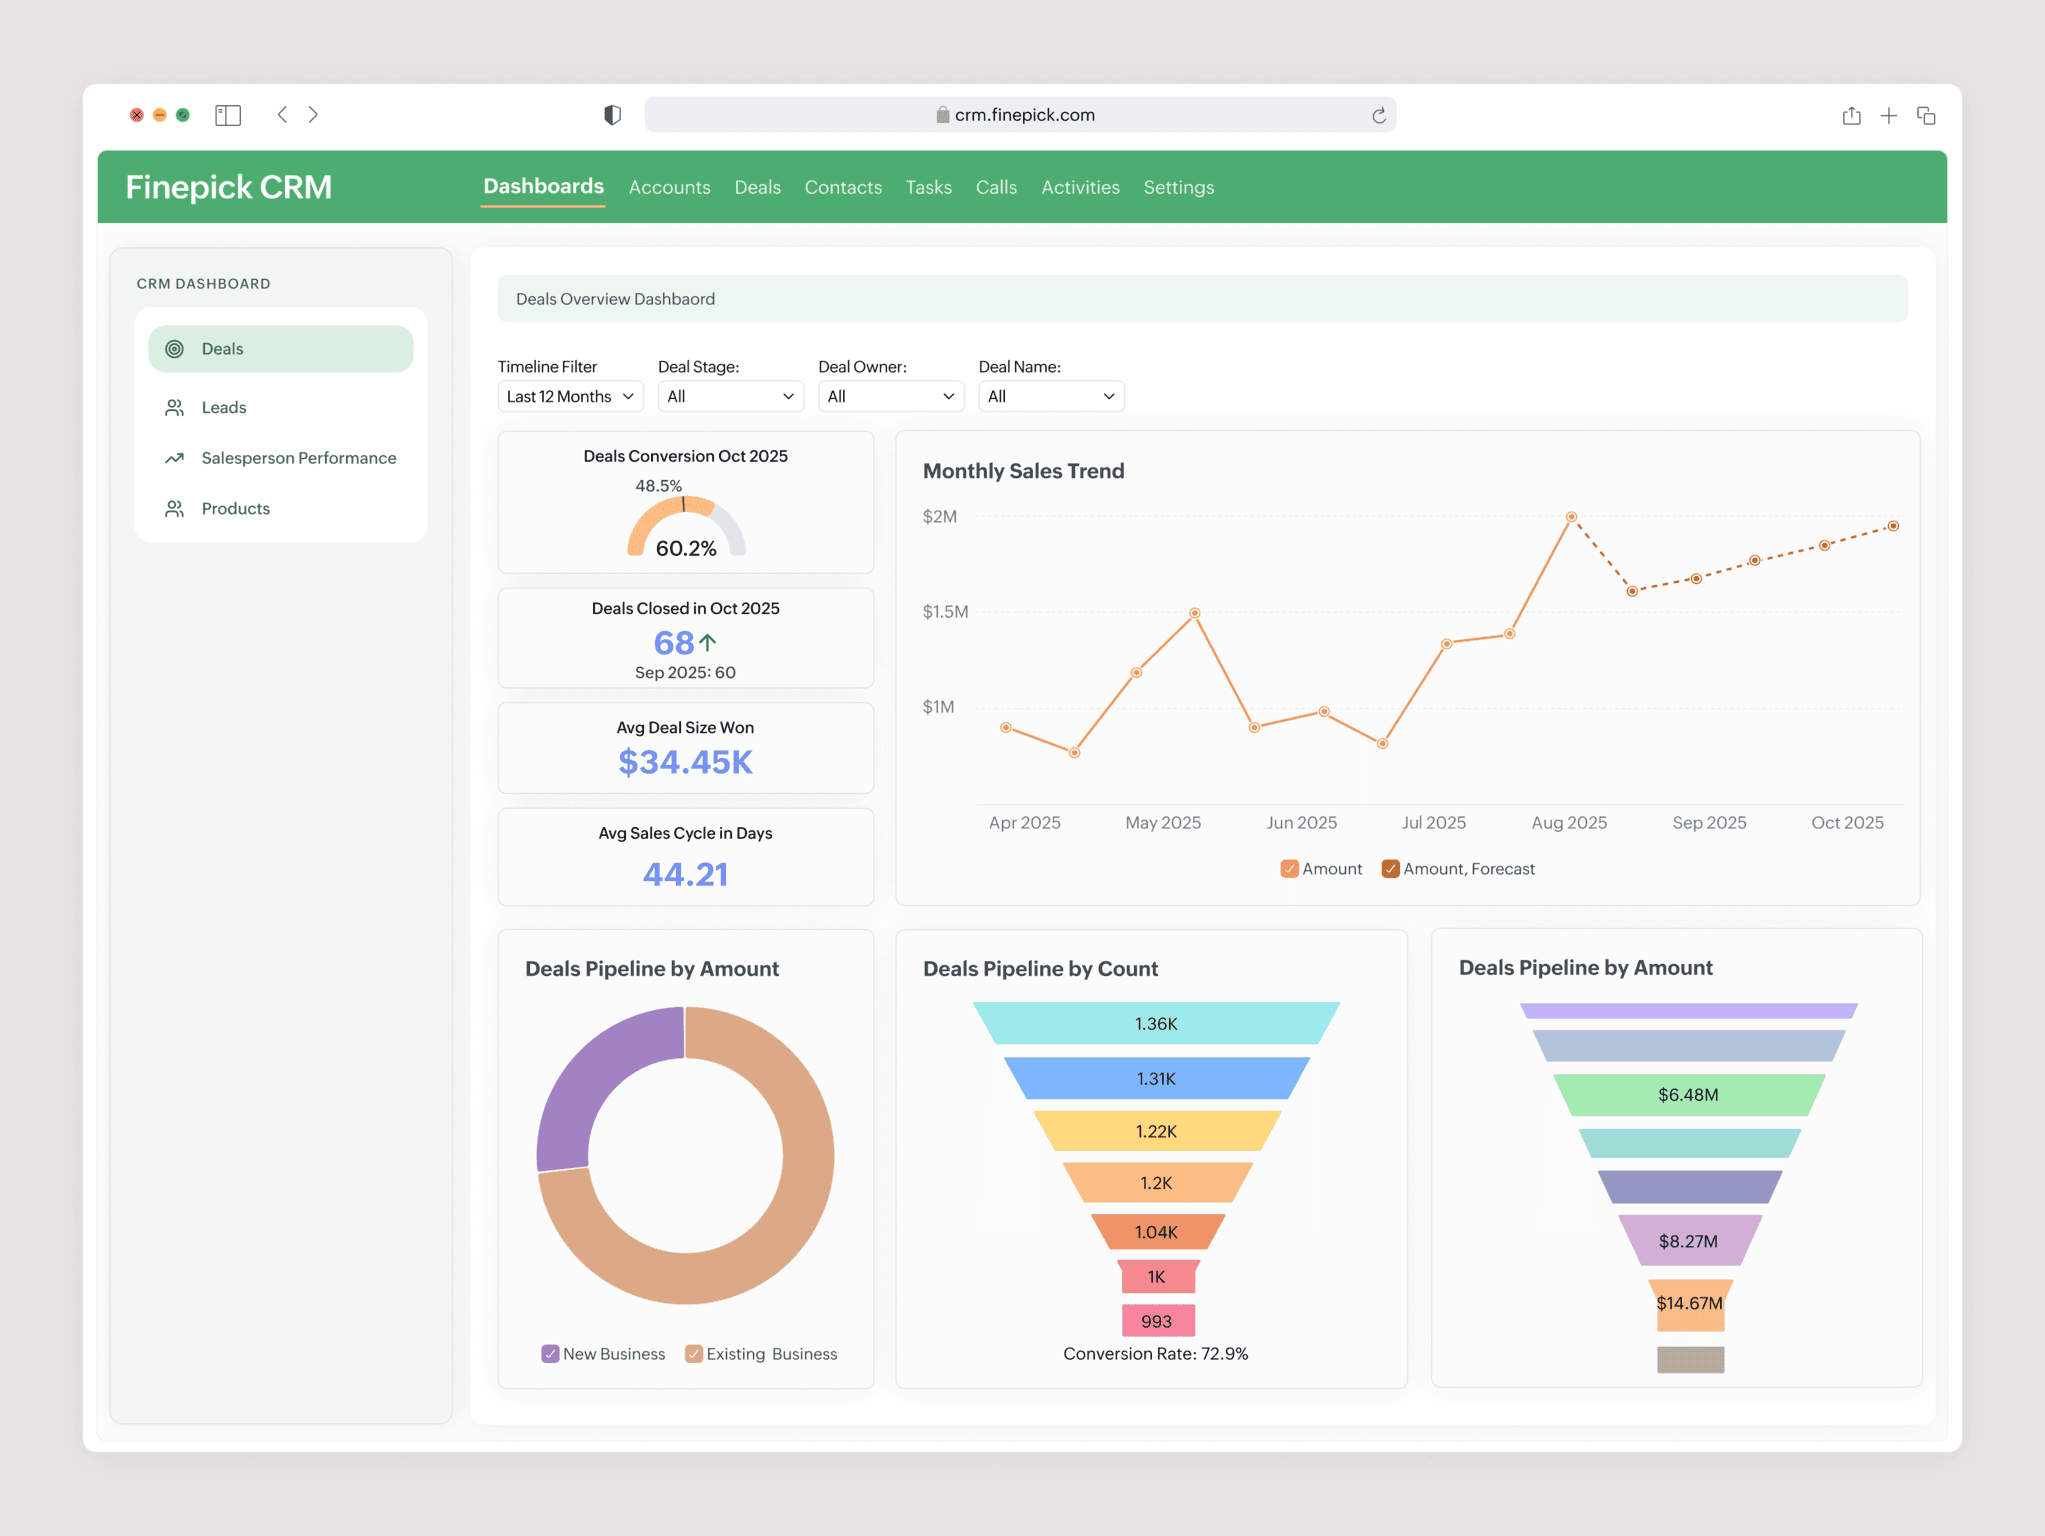
Accounting applications integrate financial reporting into everyday finance workflows, including budget-versus-actual analysis, cash flow projections, receivables ageing, and financial statements. During month-end close, a controller can move from a summarized variance report to the underlying journal entries or transactions without leaving the application. Organizations producing statutory reports or audit documentation should also evaluate whether the reporting platform supports highly formatted, print-ready outputs.
E-commerce and Retail Platforms
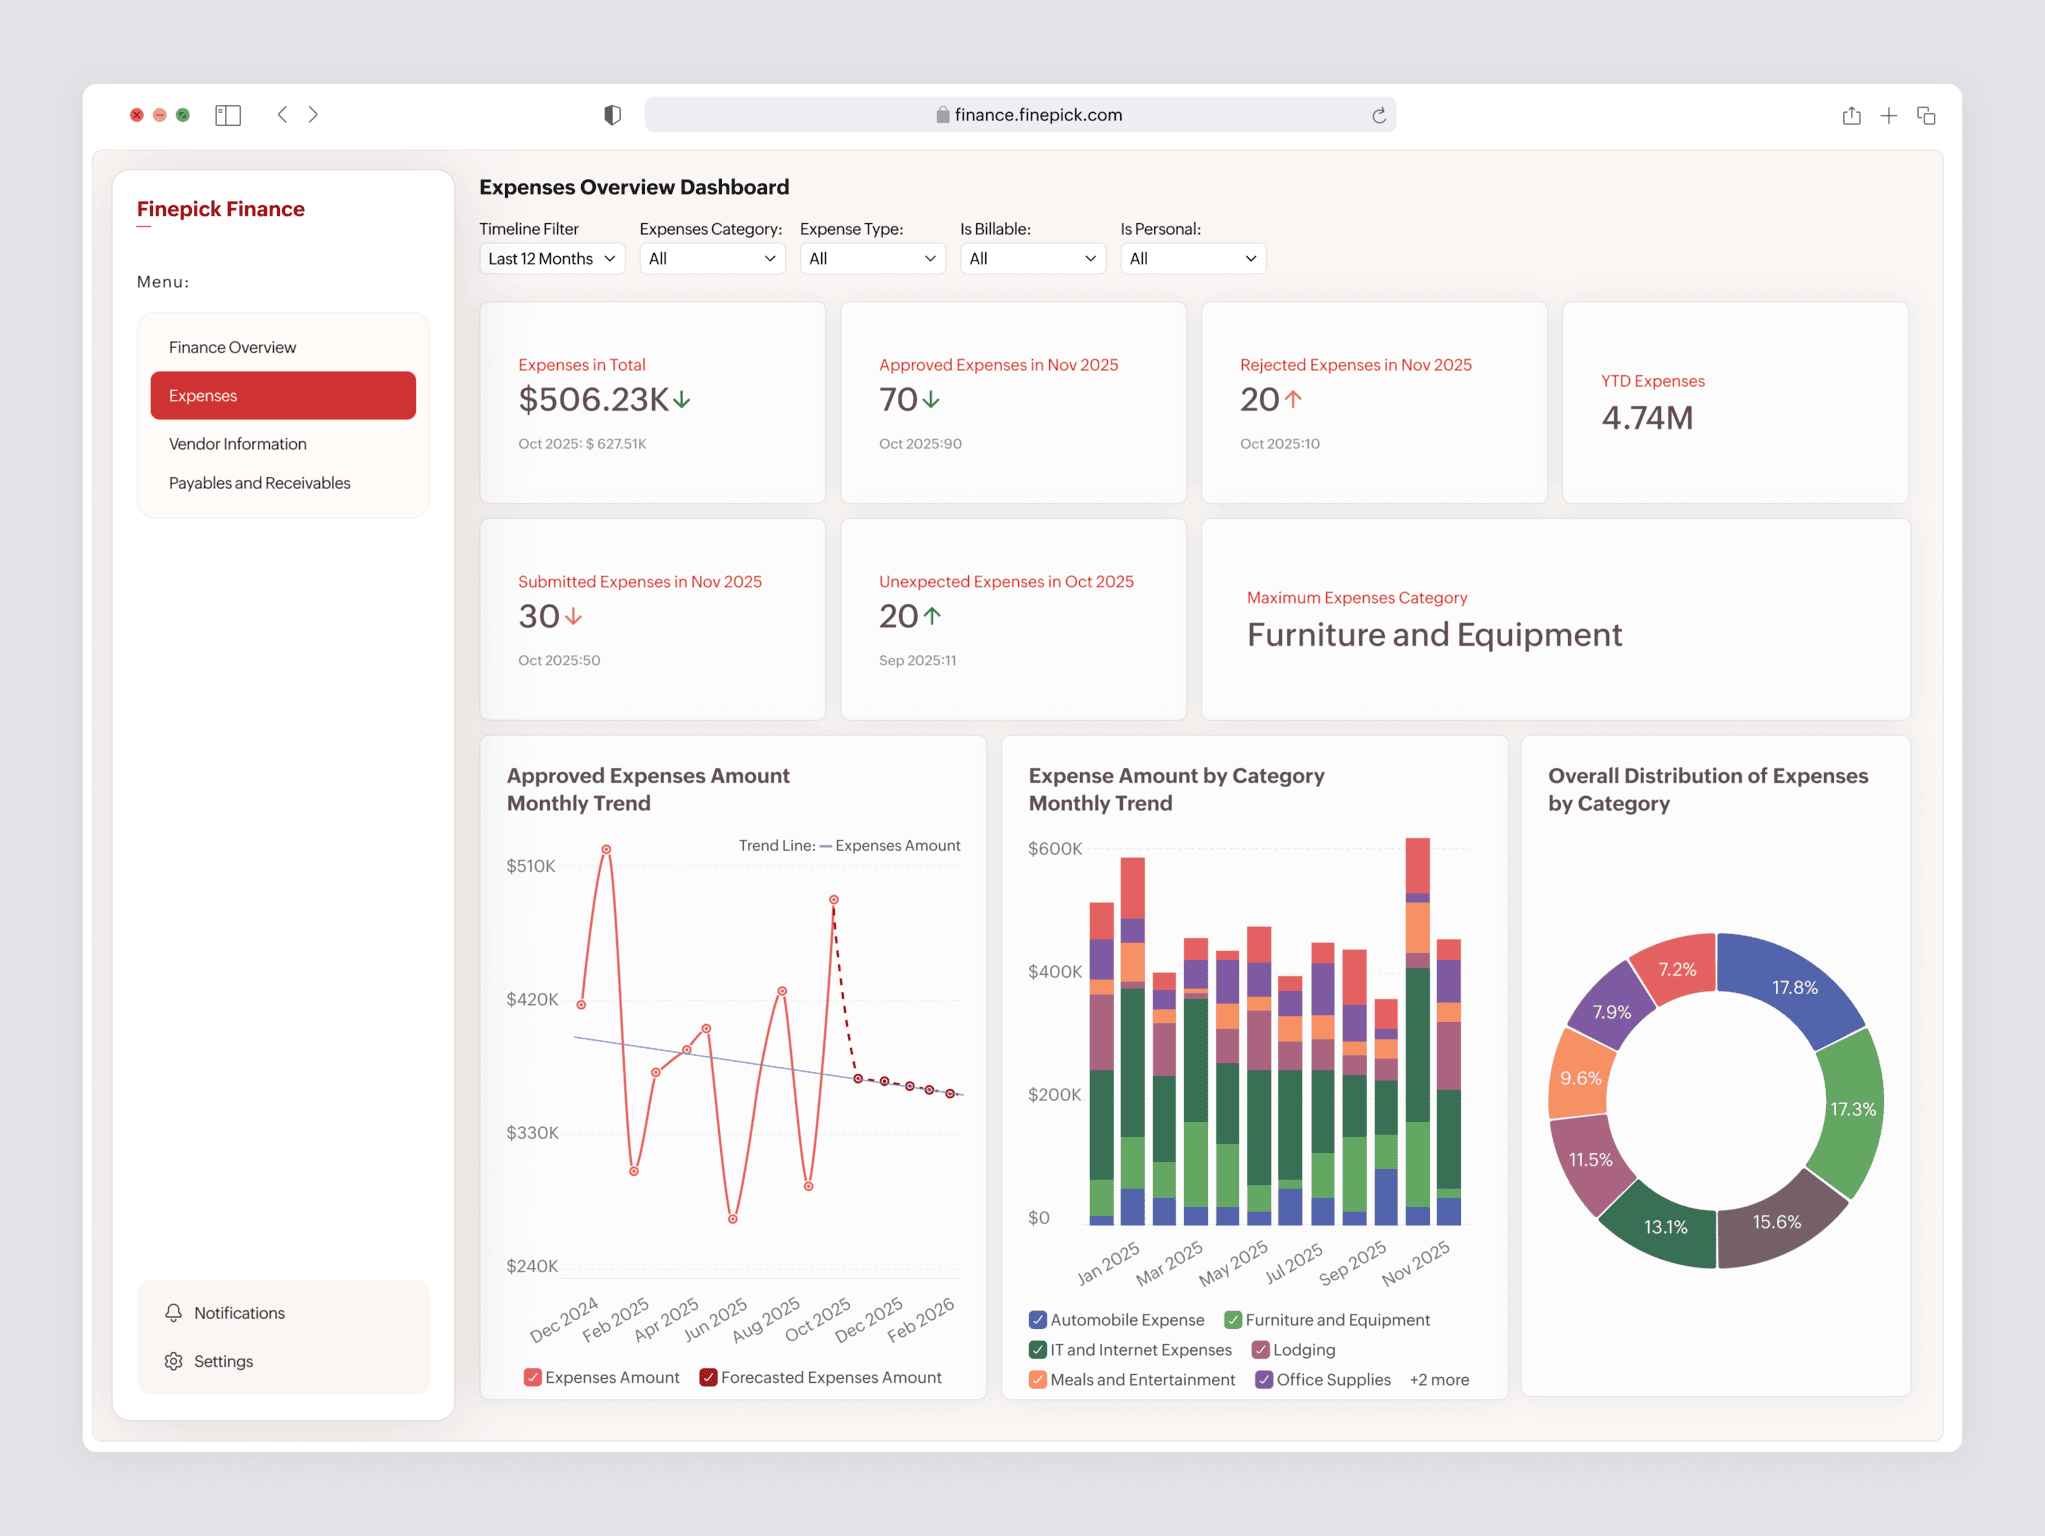
Retail applications embed reporting for inventory turnover, product performance, sales trends, and customer purchasing behaviour. A merchandising manager reviewing a slow-moving product can immediately compare sales by location, evaluate inventory levels, and make replenishment decisions from the same workspace instead of moving between operational and reporting systems.
HR and Workforce Management Applications
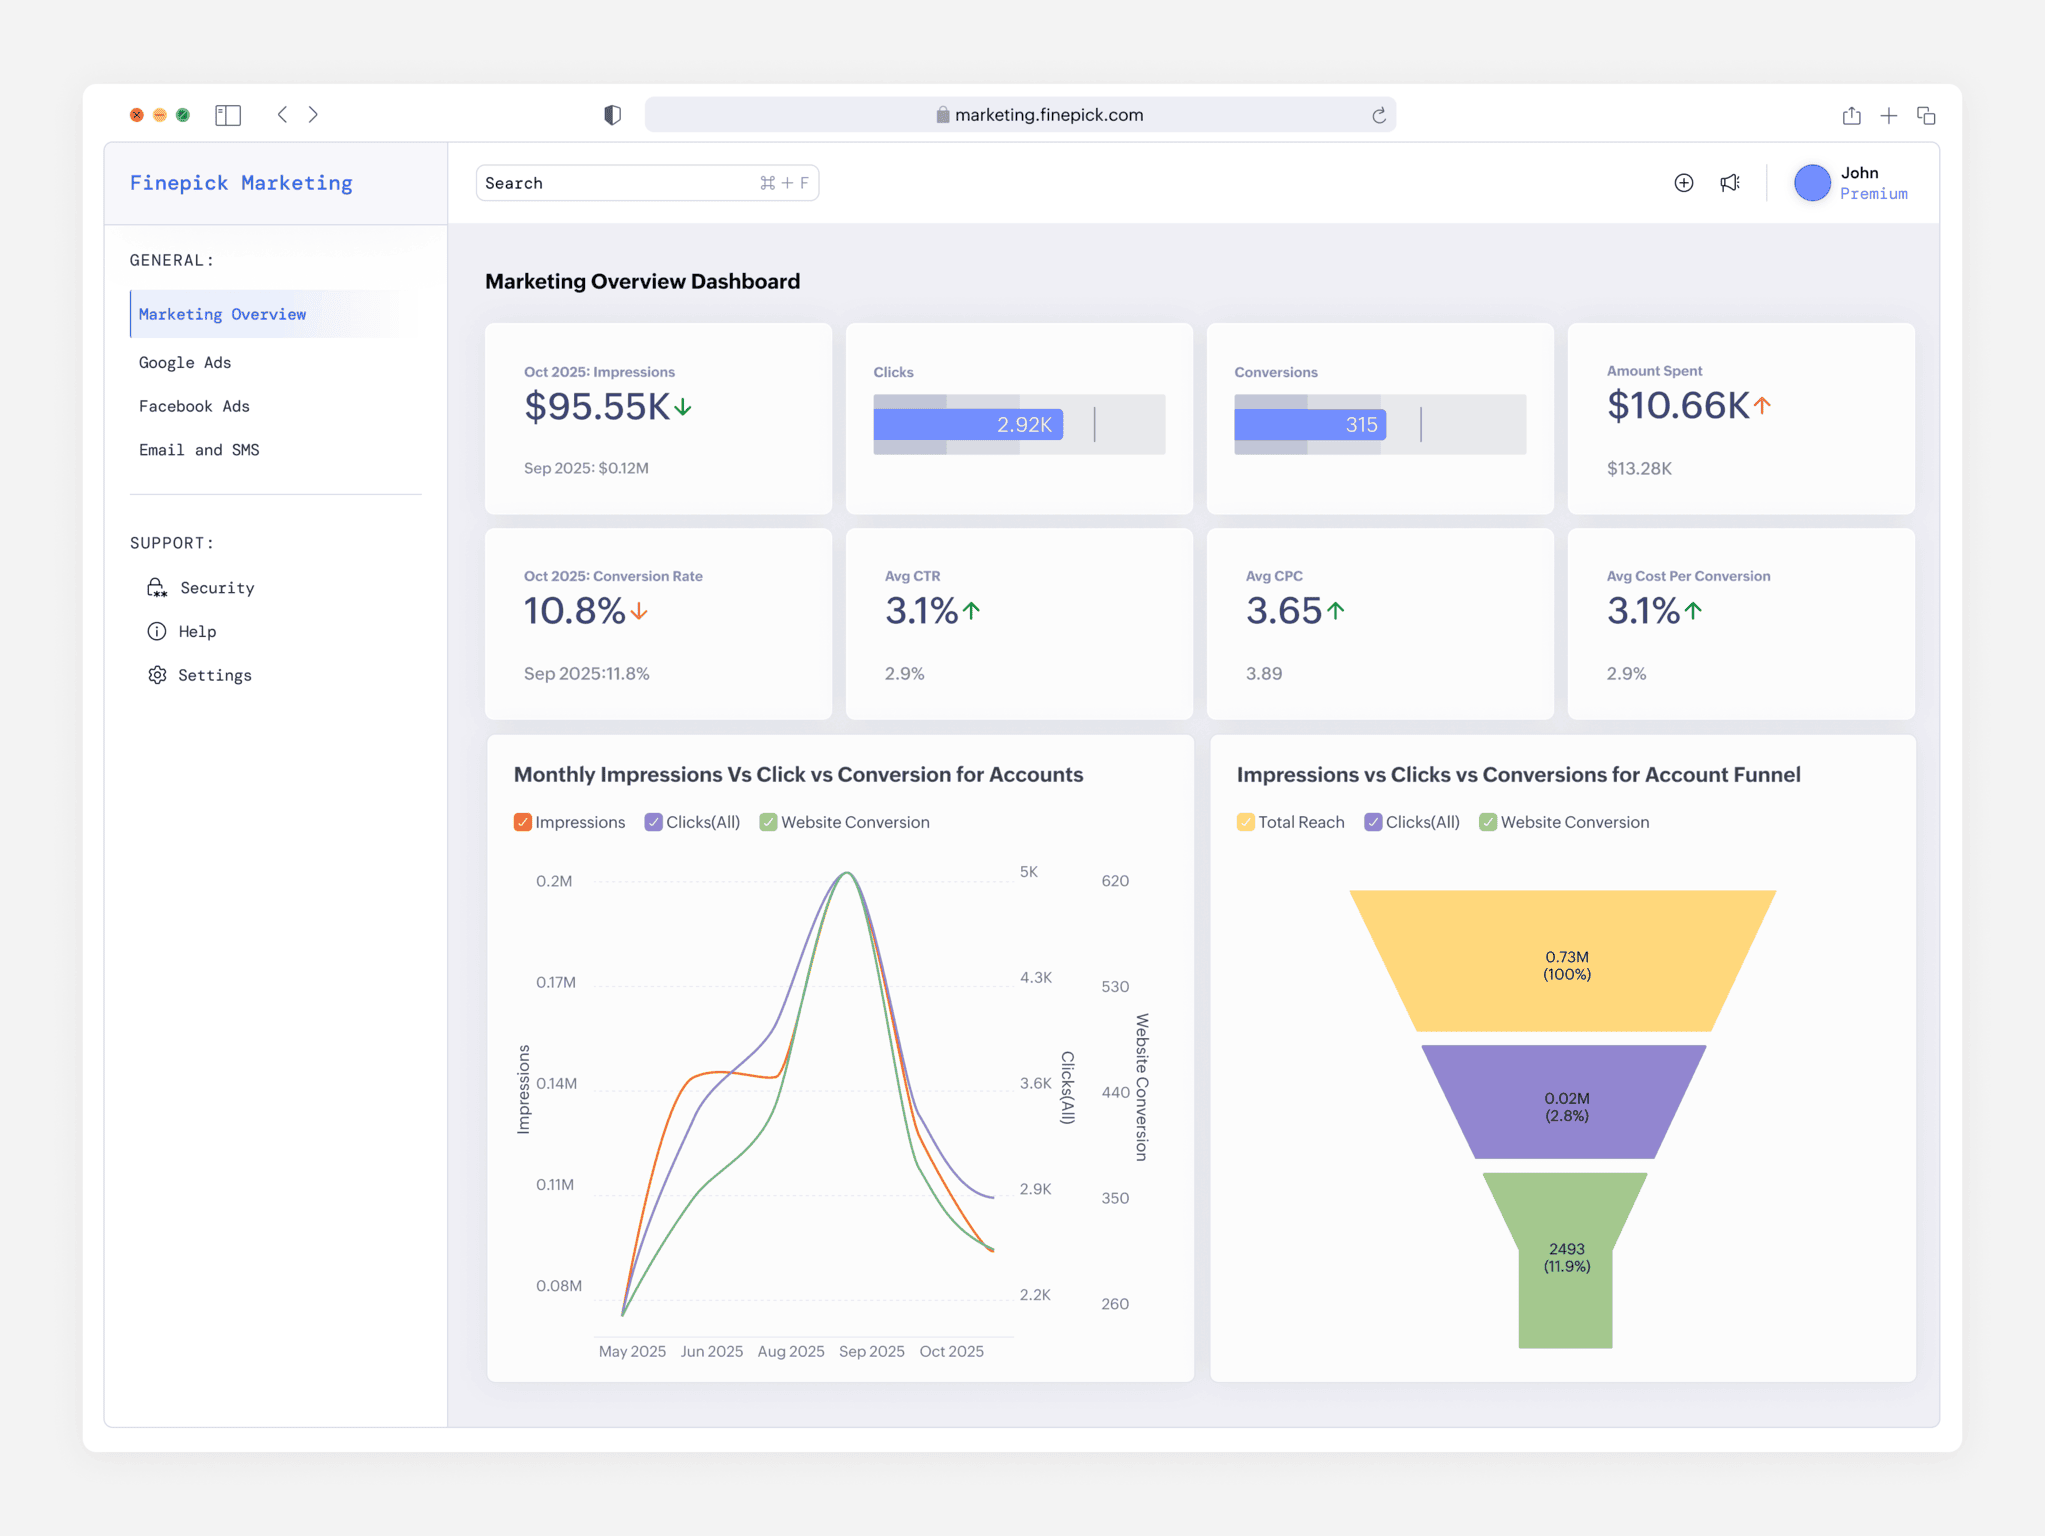
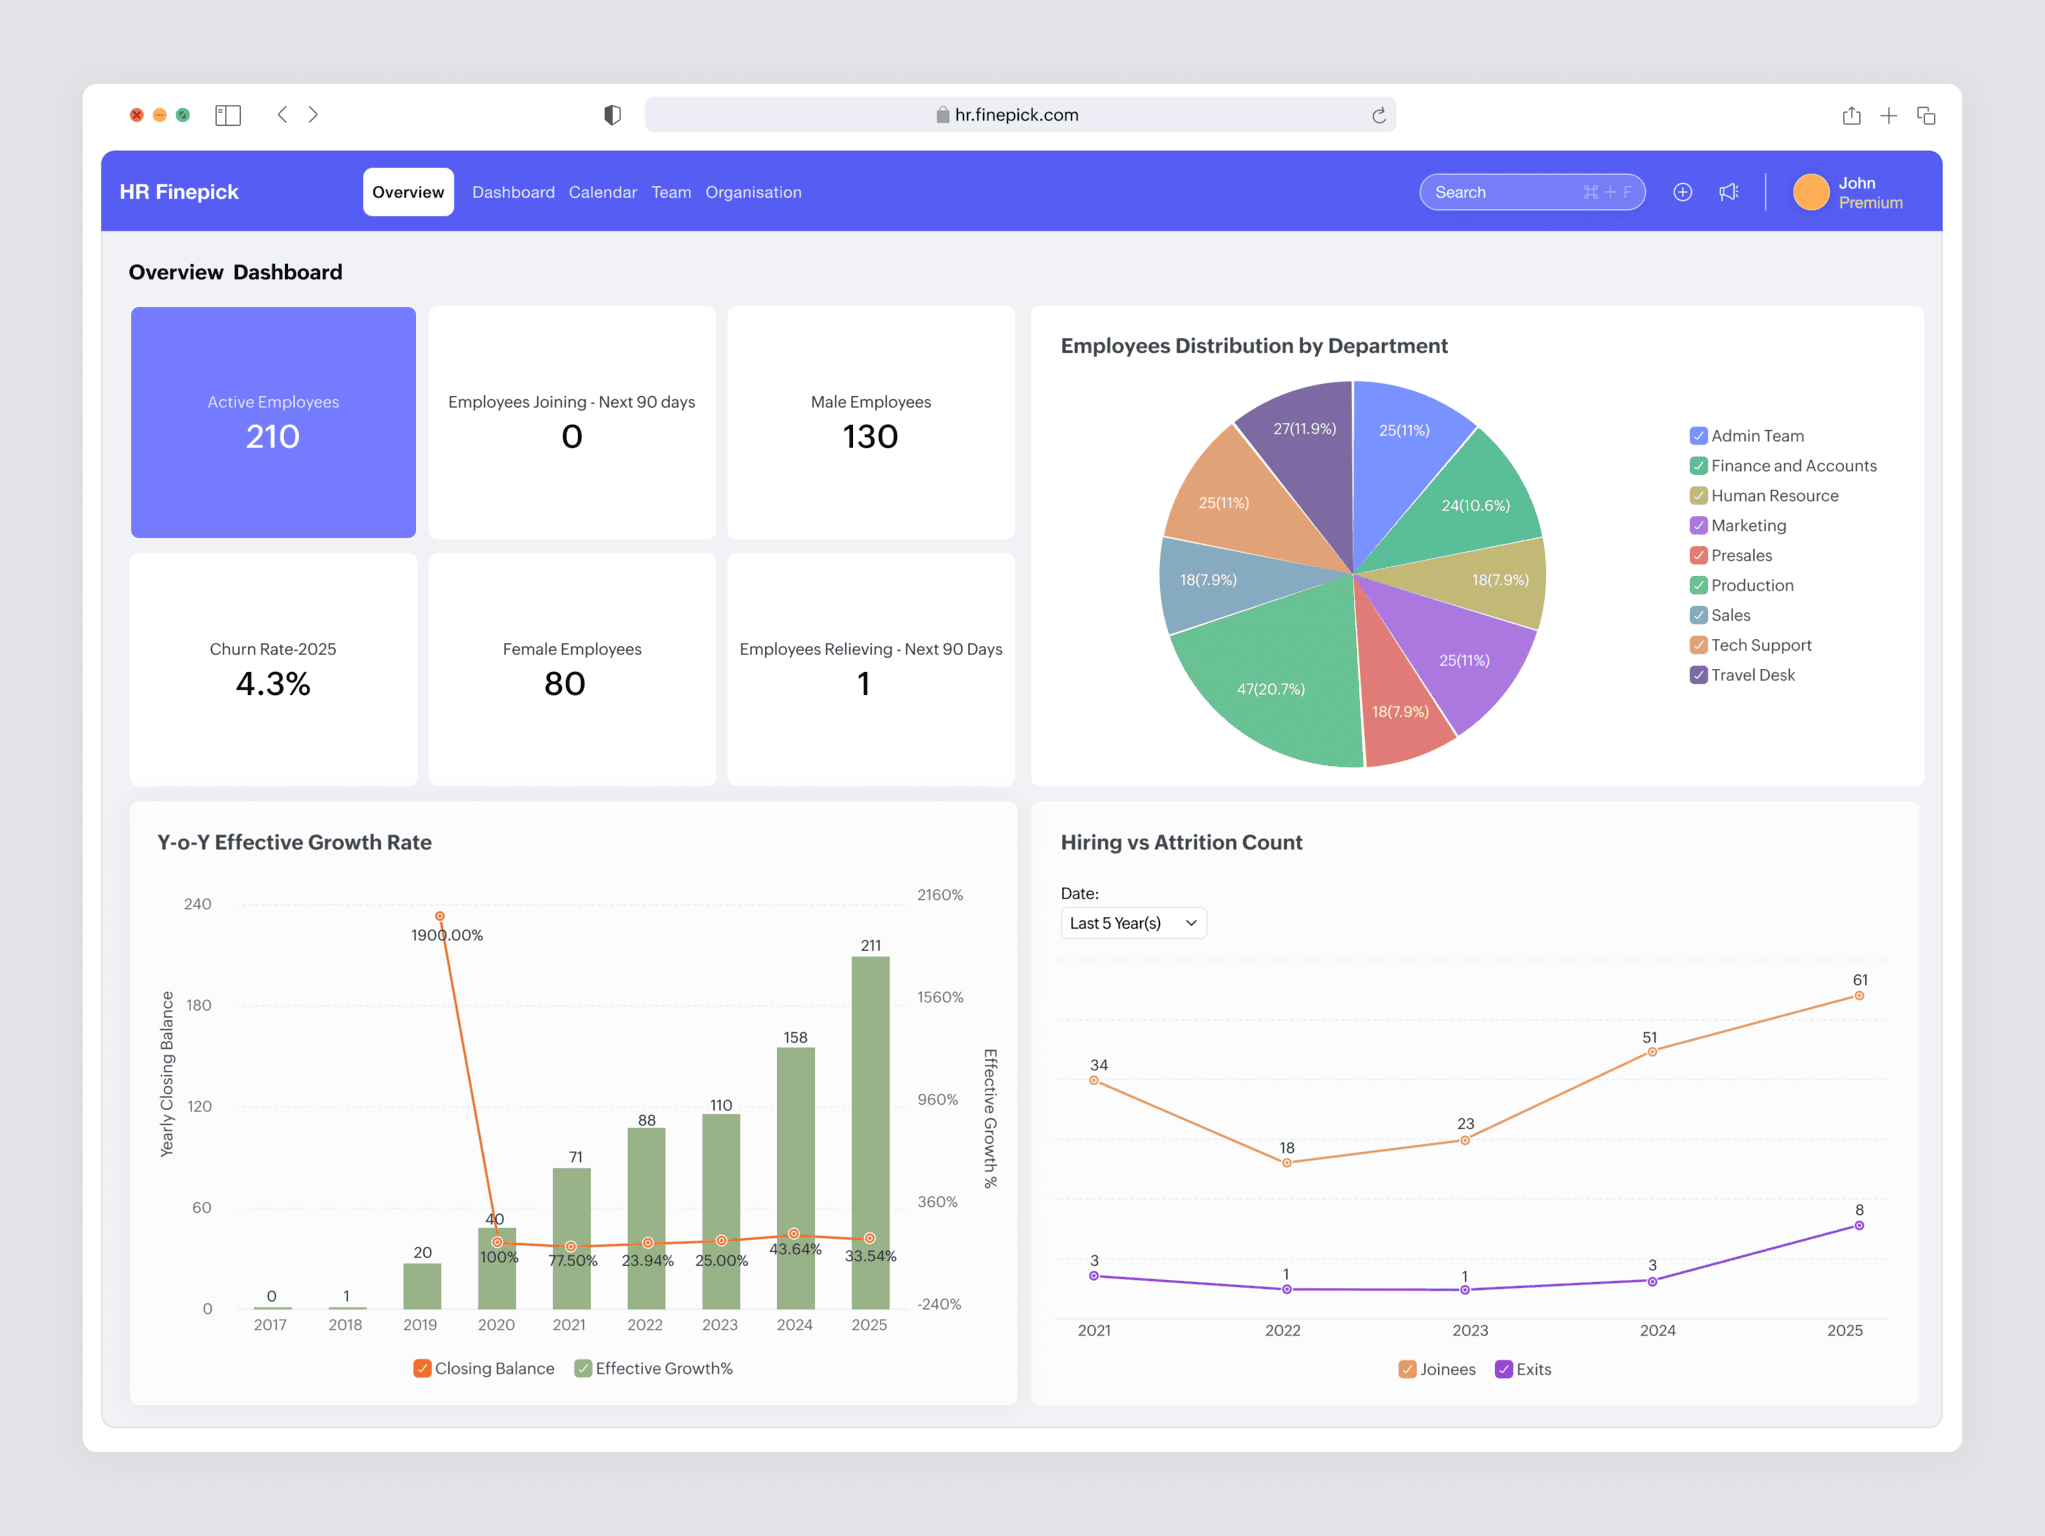
Human resources platforms use embedded reporting to analyze workforce composition, hiring trends, employee turnover, engagement, compensation, and payroll costs. Managers typically see reports for their own teams, while HR leaders review organization-wide metrics, with access controlled through the application's existing permission model. (Know more about embedded analytics for SaaS)
Field Service and Project Management Applications
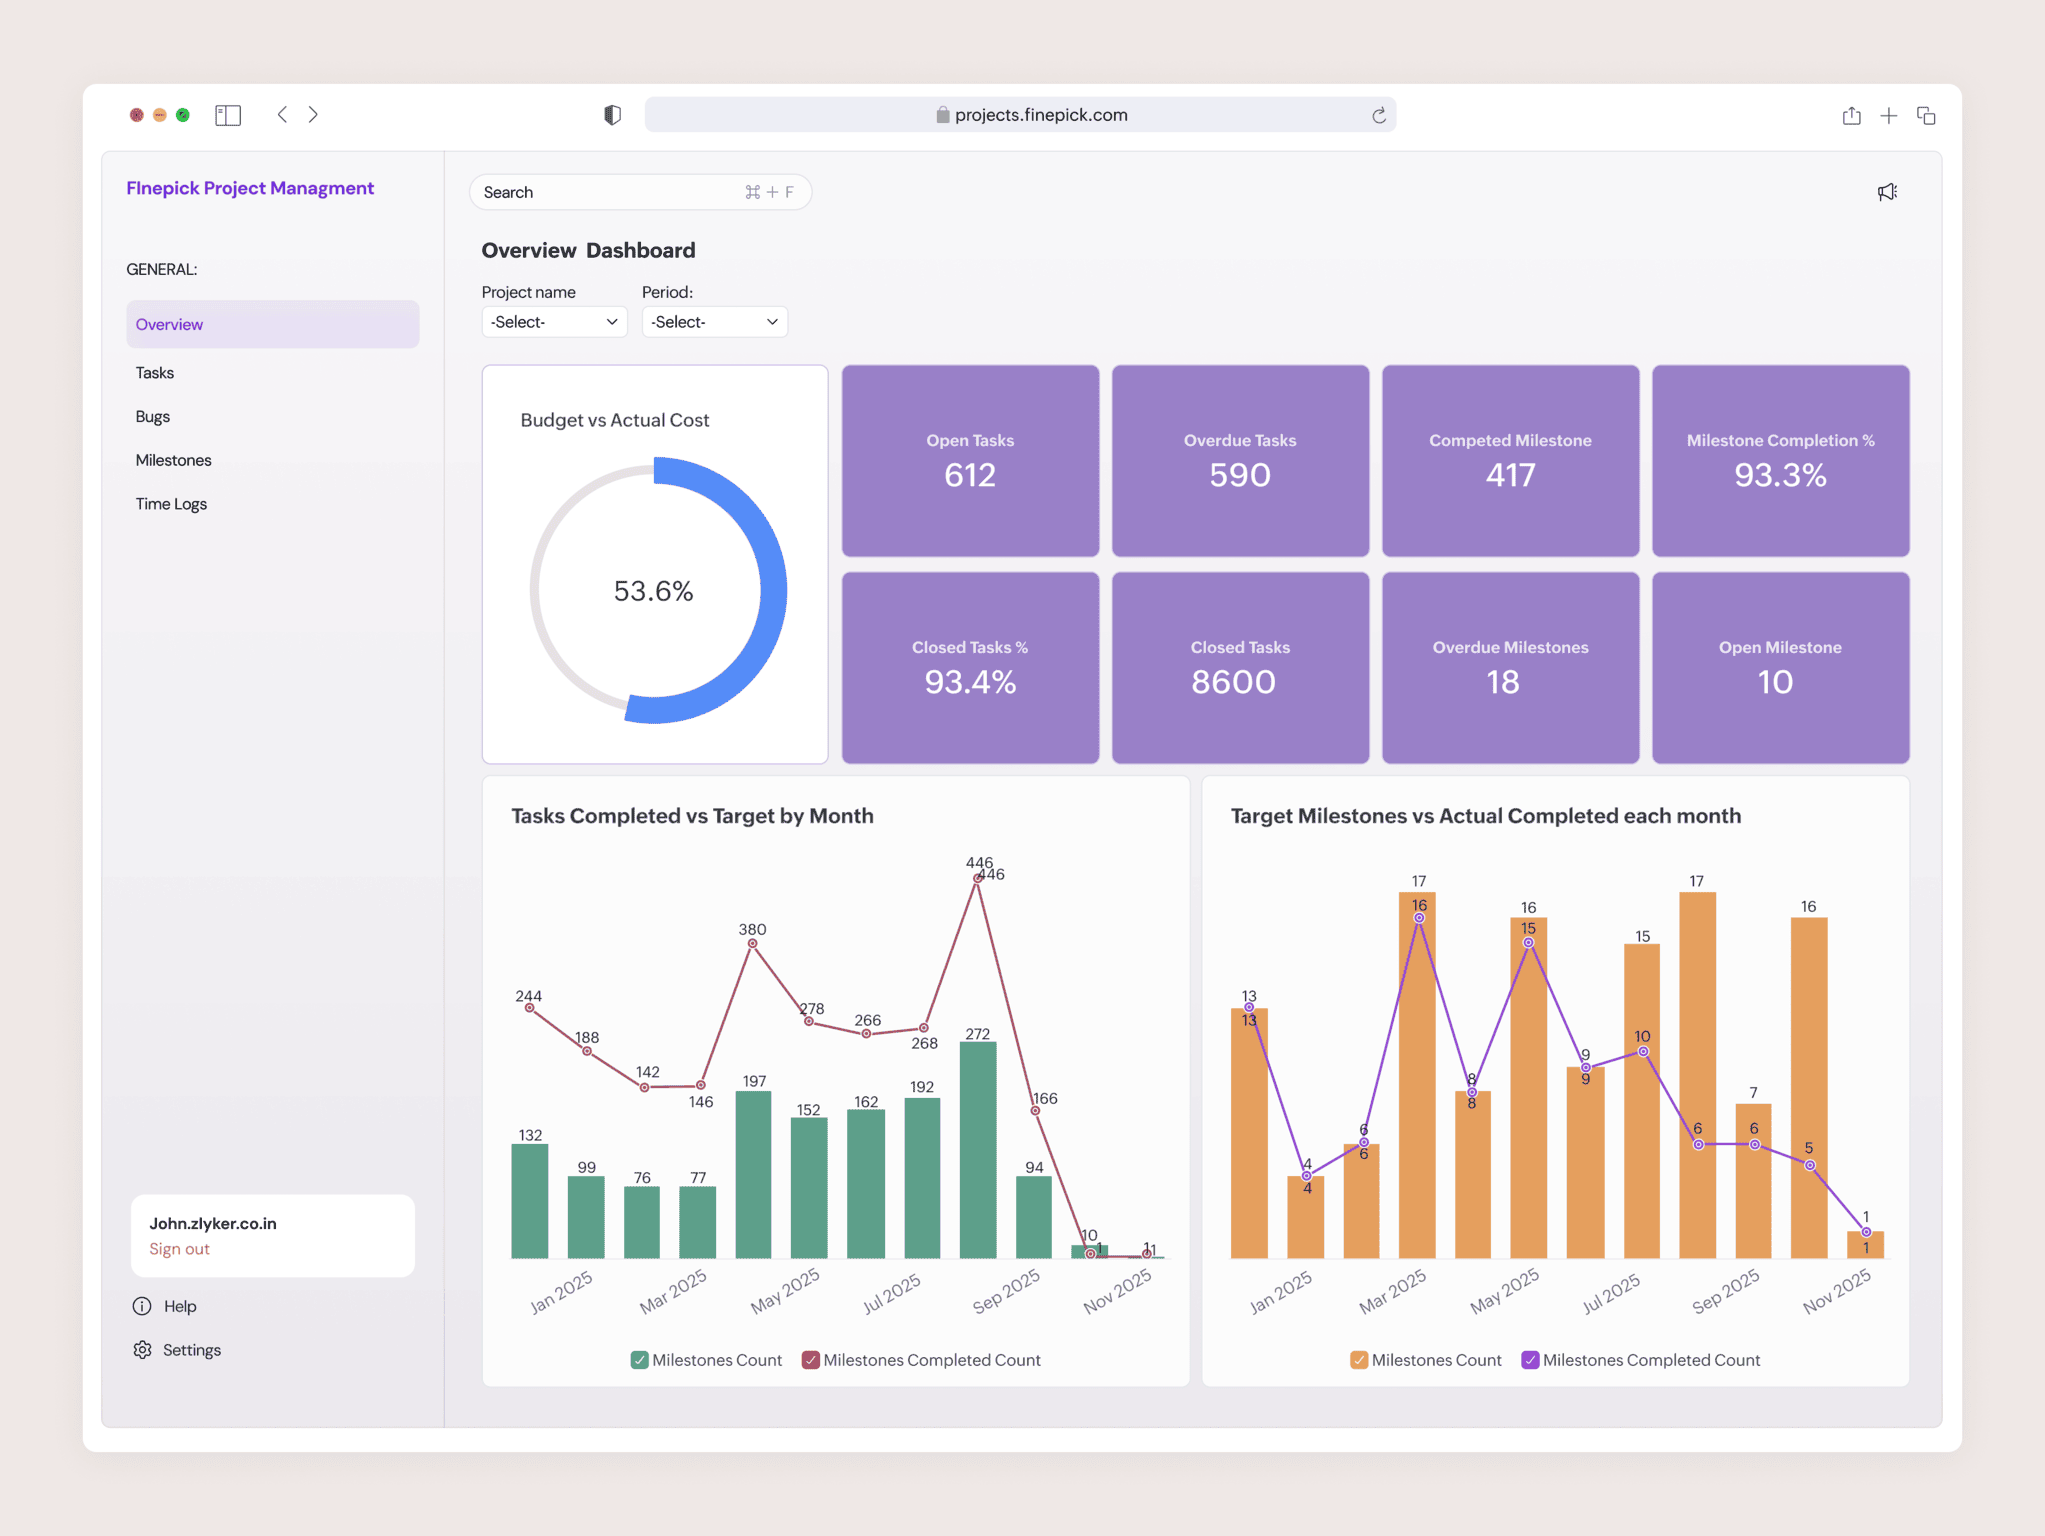
Field service and project management software embeds reporting for resource utilization, project profitability, SLA compliance, job progress, and delivery performance. Project managers and service teams can monitor work as it happens, identify potential delays, and address operational issues before they affect customers or project outcomes.
5 Practical Tips for Building Embedded Reporting That Gets Used
Successful embedded reporting depends less on the number of features and more on how well those features fit into the product experience. The following practices can help improve adoption, reduce maintenance, and make reporting a natural part of your application.
1. Enable Self-Service Reporting
When every reporting request goes through engineering, development teams quickly become a bottleneck. Give users the flexibility to create their own reports using filters, drill-downs, calculated fields, grouping options, and reusable report templates. Self-service capabilities allow customers to answer routine questions on their own while freeing product teams to focus on new features instead of recurring report requests.
2. Design Reports as Part of the Product Experience
Reports should feel like a native part of your application rather than an add-on. Support a variety of visualizations—including tables, pivot views, charts, maps, and funnels—and make them interactive so users can filter, sort, and drill into the underlying data. The easier reports are to explore, the more likely users are to rely on them during everyday work.
3. Reuse Your Existing Security Model
Users shouldn't have to manage a separate set of reporting permissions. An embedded reporting platform should integrate with your application's authentication and authorization model, supporting tenant-, role-, group-, row-, and column-level access controls. Consistent security policies reduce administrative overhead while helping prevent unauthorized access to sensitive information.
4. Make Reporting Look Like Your Product
Brand consistency matters, especially for customer-facing applications. Choose a reporting platform that supports white-label customization, including logos, colors, typography, navigation elements, and chart styling. For multi-tenant applications, the ability to apply branding at the tenant level helps each customer deliver a reporting experience that feels native to their own environment.
5. Plan for Multi-Tenant Growth Early
Multi-tenancy should be considered during the initial architecture of the reporting solution rather than added later. Separating data between tenants, applying tenant-specific security policies, and managing customer-specific content become significantly easier when these capabilities are built into the design from the beginning. This approach also supports staged feature rollouts, customer-specific dashboards, and tier-based access as the application grows.
Common Pitfalls to Avoid
Even a well-designed reporting implementation can lose value if a few common issues are overlooked.
- Static reports. Users often need to move from summary metrics to detailed records. Interactive filtering and drill-down capabilities make that possible.
- Limited flexibility. Prebuilt dashboards answer common questions, but users will eventually need reports tailored to their own requirements. Self-service reporting helps fill those gaps.
- Excessive report scheduling. Reports delivered too frequently are easy to ignore. Use alerts for exceptions and reserve scheduled reports for regular review cycles.
- Missing custom fields. If customers extend your application's data model, those custom fields should automatically become available in reports. Otherwise, reporting gradually falls out of sync with the product.
Best Embedded Reporting Tools for 2026
Embedded reporting platforms differ in how they handle integration, customization, deployment, and scalability. Some are designed specifically for SaaS vendors building customer-facing reporting, while others combine embedded reporting with broader business intelligence capabilities. The right choice depends on your application's architecture, multi-tenancy requirements, development resources, and long-term reporting strategy.
1. Zoho Analytics
Zoho Analytics is a business intelligence platform that supports both embedded reporting and internal analytics from a single environment. It provides a comprehensive set of embedding capabilities through approximately 150 REST APIs, backend SDKs, JavaScript APIs, and single sign-on, allowing developers to integrate reports and dashboards directly into web applications while maintaining a consistent user experience. The platform supports multi-tenant deployments through isolated workspaces, tenant-level branding, and extensive white-label customization. End users can also create and modify dashboards from within the embedded experience using the built-in dashboard designer, reducing the need for developers to build every report themselves.
Pros
- Extensive REST APIs, JavaScript APIs, and backend SDKs for embedded integrations.
- Supports white-label branding, tenant-specific customization, and single sign-on.
- Embedded dashboard designer enables customer self-service reporting.
- Connects to more than 500 data sources, including databases, cloud applications, APIs, and data warehouses.
- Ask Zia provides AI-assisted report creation and natural-language querying.
- Transparent public pricing for standard plans with a free trial.
Cons
- Custom domains aren't currently supported for embedded deployments.
- Multi-tenancy relies on linked workspaces rather than completely independent tenant instances.
- Built-in workflow automation isn't as extensive as dedicated automation platforms.
User feedback

"We have embedded Zoho Analytics within our internally developed financial services software. Whenever I have a new client meeting, I demonstrate the Ask Zia feature of Zoho Analytics with a question like 'what was my income last month?' Its quick reply or a visual fascinates my clients and they say, 'This is what we want.' It allows me to show them that we are a forward thinking company partnered with a global company like Zoho."
Craig RoxbyManaging Director, MagnifiPricing
Zoho Analytics offers published subscription pricing, a 15-day free trial, and no credit card requirement for evaluation. OEM and embedded deployments are licensed separately based on implementation requirements.
2.Sisense
Sisense is a business intelligence platform with a strong focus on embedded analytics. It supports pro-code, low-code, and no-code approaches, giving product teams different ways to integrate analytics into customer-facing applications. Developers can embed individual analytics components or broader dashboard experiences, making Sisense particularly relevant to organizations that need more control over how analytics appears inside their product.
Pros
- Strong focus on embedded and customer-facing analytics
- Pro-code, low-code, and no-code implementation options
- APIs and developer tools support deeper product integration
- Supports different deployment requirements, including cloud and self-managed environments
Cons
- Deeper customization can require significant developer involvement
- Implementation can become complex for teams with extensive data preparation or integration requirements
- Some capabilities and commercial terms depend on the selected package and deployment
- Pricing is not fully published, making early cost comparisons more difficult
User feedback
User reviews commonly highlight Sisense's embedding flexibility and ability to support customized analytics experiences. The trade-off is implementation complexity: teams looking for deeper customization may need more technical expertise than they would with a primarily no-code BI platform.
Pricing
Sisense does not publish a standard public price list for its embedded analytics offering. Pricing is provided through the sales process and can vary according to deployment, implementation requirements, and the analytics experience being delivered. Organizations comparing Sisense with other platforms should request a quote based on their expected production environment rather than relying on third-party pricing estimates.
See how the two compare on the Zoho Analytics vs. Sisense comparison in detail
3. Qlik
Qlik is an enterprise BI platform known for its associative analytics engine, which allows users to explore relationships across data without following a predefined query path. For embedded analytics, Qlik provides several integration options, ranging from complete embedded experiences to individual visualizations and components. This makes it relevant to enterprises that need governed analytics while retaining flexibility over how those analytics appear inside other applications.
Pros
- Associative engine supports exploratory analysis across related datasets
- Multiple embedding approaches for full applications and individual analytics components
- Strong governance and access-control capabilities for enterprise environments
- Broad analytics functionality beyond embedding, including data integration and self-service BI
Cons
- The associative model and broader platform can take time for new users and administrators to learn
- More advanced implementations may require technical expertise for setup and ongoing administration
- Complex data preparation can involve scripting or additional configuration
- Pricing can be harder to estimate when requirements extend beyond standard user-based deployments
User feedback
Users frequently highlight Qlik's associative approach as a strength, particularly for exploring relationships that may be missed by more linear reporting workflows. The learning curve and administrative complexity are more common trade-offs, especially for teams without dedicated BI expertise.
Pricing
Qlik offers multiple products and licensing models, so pricing depends on the edition, number of users, capacity, and deployment requirements. For an enterprise or embedded analytics evaluation, organizations should model costs against their expected production environment rather than relying only on an advertised entry price.
See how the two compare on the Zoho Analytics vs. Qlik comparison in detail
Why these tools stand out
- Zoho Analytics is well suited to organizations looking for a single platform that supports both embedded reporting and broader business intelligence, with extensive APIs, AI-assisted reporting, and strong white-label BI capabilities.
- Sisense is built around embedded analytics, with pro-code, low-code, and no-code paths and in-chip processing for large datasets, making it a fit for product teams building tailored, customer-facing analytics.
- Qlik centers on its associative engine for open-ended data exploration, with multiple embedding routes from full iFrame to component-level charts, suiting teams that want flexible analysis and have the technical capacity to run it.
The right choice ultimately depends on your application's architecture, reporting requirements, security model, and the level of customization your customers expect.
What to Look for When Choosing an Embedded Reporting Tool
Choosing an embedded reporting platform isn't just about comparing features. Decisions made during evaluation affect how easily the platform integrates with your application, how well it scales as customers are added, and how much engineering effort it requires over time. The criteria below are the ones that most often determine the long-term success of an embedded reporting deployment.
Flexible Embedding Options
Not every application needs to embed an entire reporting portal. Some products require only a chart or dashboard, while others need report builders, filters, or analytics workspaces integrated into existing pages. Look for JavaScript APIs or SDKs that support component-level embedding rather than relying solely on full-page iFrames. The more elements you can embed independently, the more control you have over your application's user experience.
Performance at Scale
Embedding reporting changes the scale of your analytics deployment because every customer's users become reporting users. During evaluation, test performance with production-sized datasets and realistic levels of concurrent usage instead of relying on vendor demonstrations or sample data.
Broad Data Connectivity
Most reporting environments combine data from multiple systems rather than a single application database. Evaluate whether the platform connects to cloud and on-premises databases, SaaS applications, data warehouses, files, APIs, and other operational data sources. Native connectors simplify integration, while APIs provide flexibility for proprietary systems.
Security and Access Control
Reporting should follow the same security model as your application. Look for support for tenant isolation, role-based permissions, row-level and column-level security, and a semantic layer that maps application permissions to reporting access. Before making a decision, confirm that the platform supports your tenancy model without requiring custom security logic.
Self-Service Reporting
As reporting requirements evolve, users will want to build and modify reports without depending on developers. Evaluate the report builder from the perspective of a business user rather than an analyst. The easier it is to create reports, apply filters, and customize dashboards, the fewer reporting requests your engineering team will receive.
Deployment Options
Deployment requirements vary across organizations. Some need analytics to run within their own cloud environment or on-premises infrastructure to satisfy governance or compliance requirements, while others prefer a managed SaaS deployment. Review the deployment models available and understand whether functionality differs between them.
Developer Experience
Developer tools can have as much impact on implementation time as the reporting features themselves. Comprehensive documentation, SDKs, API references, sample applications, testing environments, and responsive technical support make integrations easier to build and maintain. Learn more about available embed APIs.
Pricing That Supports Growth
Licensing should remain sustainable as your customer base expands. If pricing is based on individual users, estimate costs using projected customer growth rather than your current deployment. A pricing model that scales predictably with your business is usually a better long-term fit than one that becomes more expensive as adoption increases.
Benefits of Embedded Reporting
The earlier sections explained where embedded reporting fits into an application and what to evaluate before choosing a platform. Once it's implemented, the impact is felt in two places: by the software vendor delivering the product and by the customers using it every day.
What Changes for the Software Vendor
Analytics Becomes a Revenue Opportunity
Reporting is one of the easiest capabilities to package into different subscription tiers. A learning management platform, for example, might include attendance and completion reports in every plan while reserving custom report builders, cohort comparisons, and scheduled executive reports for enterprise customers. Because the reporting capability already exists, expanding the offering is largely a commercial decision rather than a development project. For Catalyst, white-labeled analytics became a core part of its offering and according to their managing director, contributed significantly to top-line growth.
Engineering Teams Focus on the Core Product
Building a reporting platform internally means maintaining charting, query processing, security, exports, and ongoing enhancements alongside the rest of the application. Licensing an embedded reporting platform shifts that responsibility to the provider, allowing engineering teams to spend more time on the features that differentiate the product. As self-service reporting adoption grows, requests for custom reports often decline as well. The operational gains can extend beyond engineering:Wingman Media reported a 60% reduction in the labor hours spent on reporting after adopting Zoho Analytics as their unified reporting solution.
Reporting Stops Becoming a Competitive Weakness
Reporting gaps frequently appear during competitive evaluations and renewal discussions. While better reporting rarely wins a deal on its own, it can remove one of the reasons prospects or customers consider alternative products. If your organization tracks competitive losses or churn reasons, reporting is worth reviewing as a category before and after introducing embedded reporting.
The Product Delivers More Value
A well-integrated reporting experience is visible in every demonstration, trial, and customer interaction. Instead of offering exports to external tools, customers can explore data directly within the application, making reporting part of the product rather than an afterthought. LifeSherpa, for example, embedded contextual reports and self-service reporting into its product, increasing its value proposition by 40%. The company now considers analytics an integral part of the value it delivers and a selling point for its product.
What Changes for the End User
Decisions Happen Faster
When reports are available within the application, users can investigate issues and act immediately. A support manager who notices first-response times increasing, for example, can review ticket volumes and agent workloads from the same interface before reallocating resources. Without embedded reporting, that process may involve exporting data, rebuilding reports, and making decisions hours or days later. Market Dojo, for example, reduced the time required for analysis from two days to minutes, enabling its teams to access insights more quickly during meetings and everyday decision-making.
Routine Reporting Becomes Automated
Many organizations still recreate the same operational reports every week or month. Scheduled reporting and automated distribution remove much of that repetitive work while reducing the risk of outdated versions or manual errors.
Reporting Reaches More Users
Standalone BI tools often require separate logins, additional training, and a deliberate effort to switch between applications. By presenting reports within software that users already rely on, embedded reporting lowers those barriers and makes analytical information accessible to a much broader audience. After embedding Zoho Analytics within its ERP system, AQUAGROUP made contextual reports and dashboards more widely available across the organization, improving visibility and expanding access to business insights.
Users Find Answers Independently
Self-service reporting allows users to create, modify, and explore reports without raising support requests or waiting for engineering teams to build new dashboards. Users receive answers more quickly, while product and support teams spend less time responding to routine reporting requests.
Getting Started with Zoho Analytics
Choosing an embedded reporting platform is ultimately about balancing flexibility, scalability, and implementation effort. The right solution should integrate with your application, support your security and tenancy model, and continue to scale as your customer base grows.
If you're looking for a platform that combines embedded reporting with broader business intelligence capabilities, Zoho Analytics provides a comprehensive set of tools for building customer-facing reporting experiences. From APIs and SDKs to white-label customization, self-service reporting, AI-assisted insights, and multi-tenant deployment support, the platform is designed to help software vendors deliver embedded reporting without building and maintaining a reporting engine from scratch.
Explore how Zoho Analytics fits your application with a personalized demo, or request a pricing quote based on your deployment and licensing requirements.
Schedule a DemoGet a Price QuoteEmbedded Reporting FAQs
What is a real-world example of embedded reporting success?
Magnifi, a financial forecasting platform for business advisors, embedded Zoho Analytics into its software after looking for a reporting solution that could integrate with its existing application. Interactive dashboards are now a core part of the product experience and are used extensively during customer demonstrations. According to Magnifi, the company converts 9 out of 10 leads, with dashboards shared across 50+ users serving 20+ businesses.
What is the future of embedded reporting?
Embedded reporting is evolving beyond static dashboards toward more interactive and AI-assisted experiences. Users increasingly expect to ask questions in natural language, generate reports on demand, and receive proactive insights without manually exploring data. Self-service reporting is also becoming a standard capability in modern business applications.
What is the ROI of embedded reporting?
The return on investment typically comes from several areas. Organizations avoid the time and cost of building a reporting platform internally, software vendors can package analytics as a premium offering, support teams spend less time creating custom reports, and customers are less likely to look for external reporting tools. The overall return depends on your deployment model, customer adoption, and licensing costs.
Why choose Zoho Analytics for embedded reporting?
Zoho Analytics combines embedded reporting with broader business intelligence capabilities in a single platform. It supports APIs and SDKs for embedding, white-label customization, single sign-on, self-service reporting, AI-assisted insights, and multi-tenant deployments, allowing organizations to deliver customer-facing reporting without building and maintaining a reporting engine themselves.
How does embedded reporting improve the customer experience?
Embedded reporting gives users access to reports and dashboards within the application they already use. Instead of exporting data or opening a separate BI platform, they can review information, investigate trends, and make decisions from the same interface where business activities take place.
Can embedded reporting be white-labeled?
Yes. Many embedded reporting platforms support white-label customization so reports and dashboards match the host application's branding. Zoho Analytics includes options for customizing logos, colors, typography, navigation elements, and tenant-specific branding to provide a consistent experience for different customers.
What is the difference between embedded reporting and embedded analytics?
Embedded reporting focuses on presenting information through reports, dashboards, and interactive visualizations within an application. Embedded analytics is broader, encompassing reporting as well as capabilities such as data preparation, semantic modeling, advanced analysis, and AI-assisted insights.
How is embedded reporting implemented?
Embedded reporting is typically integrated using REST APIs, JavaScript APIs, SDKs, or iFrames. Component-level embedding offers greater flexibility because individual data visualizations can be incorporated directly into application pages, while iFrames generally provide a simpler but less customizable integration approach.
What's the best way to deliver embedded dashboards inside a customer portal?
- iframe embedding with signed URLs: The fastest route. Each dashboard loads through a secure, permission-scoped URL, so a customer sees only their own data. Best when you need to ship quickly without deep front-end work.
- JavaScript SDK embedding:Loads dashboards directly into your portal's front end for tighter interaction and custom event handling. Best when the dashboards need to respond to actions elsewhere in the portal(Know more about embedded dashboards).
- API-driven white-label embedding:Full control over rendering, theming, and user provisioning. Best for multi-tenant SaaS portals that need dashboards to look native and scale across many customer accounts(Know more about embedded analytics architecture ).
The best way to deliver embedded dashboards inside a customer portal is to embed them through a secure, tokenized method that authenticates each user, isolates their data, and matches the dashboards to your portal's design. Three delivery options cover most portal scenarios:
Whichever method you choose, four things determine whether the delivery holds up in production: row-level security to keep tenant data separate, single sign-on so users aren't asked to log in twice, theming that inherits your portal's fonts and colors, and a hosting model that scales with your customer count(Know more about embedded analytics for SaaS).
Can you suggest customer-facing analytics tools that can be embedded into our SaaS platform?
Customer-facing analytics platforms should support secure embedding within a multi-tenant product. The important question is whether authentication, data permissions, and tenant separation continue to work after analytics is placed inside your application. Also consider how much control developers have over the experience. Some products need complete dashboards, while others need individual charts or more customized analytics interfaces. Zoho Analytics supports customer-facing embedding and access controls designed to restrict users to the data available to them.
How can we embed branded survey and feedback reports into our product?
Survey tools collect responses, but their built-in reporting cannot be embedded inside your product under your own brand. To show customers branded survey and feedback reports without leaving your app, use an embedded reporting platform that owns the reporting layer. Look for three things: connectivity that pulls survey responses in automatically, per-tenant white-label branding, and embedding through APIs, SDKs, or iFrames so reports read as a native feature. Zoho Analytics brings survey data from Zoho Survey and other tools into embedded reports, with multi-tenant isolation so each customer sees only their own responses. It connects to 500 or more data sources, so survey results can sit alongside product usage or billing data in one view. See the embed API options, white-label BI capabilities, and embedded analytics for SaaS for multi-tenant delivery.
When do you need an embedded analytics platform rather than a reporting integration alone?
A reporting integration surfaces existing reports inside your app. An embedded analytics platform does that and adds data preparation, a semantic model, self-service report building, and AI-assisted analysis. Which one you need depends on how far your users go: if they only view predefined reports, a reporting integration suffices; if they build their own reports, blend sources, or ask questions of the data, you need the fuller platform. The best platforms cover both, so you start with embedded reports and extend into deeper analytics without changing tools. Zoho Analytics supports both embedded reporting and broader analytics from one environment, with roughly 150 REST APIs, JavaScript APIs, and SDKs for integration, plus a semantic model and Ask Zia for self-service. See how it connects through data integration and the embed API.
Can you suggest customer-facing analytics tools with enterprise-grade security?
Start with the security and compliance requirements your own customers expect you to meet. Verify how a vendor handles authentication, authorization, encryption, auditing, and tenant separation, then check which certifications apply to the service and deployment you plan to use. For regulated deployments, requirements may also include data residency or industry-specific controls. Zoho Analytics provides role-based and data-level access controls, SSO, and additional security and governance capabilities. Verify individual certifications and compliance requirements against Zoho’s current documentation before procurement.
We need a code-first way to embed a multi-tenant operational report, like a delivery heat map, into our product. What should we look for?
For a code-first embedded report, look for a platform whose embedding, provisioning, and isolation are all driven through APIs, so analytics fits your existing development workflow rather than a separate admin console. Three things matter most. First, a full REST and JavaScript API surface to create workspaces, manage users, and embed reports programmatically as your product provisions accounts. Second, multi-tenant isolation enforced by the platform, so an operational report like an on-time delivery heat map serves each customer their own data from one shared definition. Third, live data connectivity, so the report reflects current fulfillment status without manual refreshes. This keeps the report a maintained part of your product rather than a stack your team builds and operates. Zoho Analytics provides this through its REST and JavaScript APIs, engine-level tenant isolation and row-level security, and connectivity to 500 or more data sources, so a shared report stays correctly scoped for every customer.
How much control do developers get over embedded analytics?
Control starts with the delivery method, and the right one depends on how much customization the report needs. iframe embedding places a specific report through a URL and is straightforward for simpler deployments. API integration gives greater control over authentication, user interactions, and how reporting fits your product's workflows. JavaScript SDKs go further, letting developers embed reports as a native part of the application.
Whichever method you choose, developers define what each user can access. Role-based settings, row-level filters, and time-bound embed tokens for single sign-on keep each user scoped to the reports and data they are permitted to see. For how these controls hold up as data volumes and concurrent users grow, see embedded analytics architecture.