- 16K
Customers
- 3M
Users
In this article
Introduction to Embedding AI-powered Analytics
Embedded analytics places reports and analytical tools inside the products people already use. AI can add functions such as forecasting, alerts, queries in common language, or auto-generated explanations depending on how reporting is introduced into the product.
Why businesses embed AI-powered analytics
Embedding AI-powered analytics changes how reporting becomes part of a product. Instead of expanding reporting through additional tools, organizations use AI to reduce manual investigation, make reports easier to work with, and support broader access to business data.
Faster access to information:
Some reporting questions do not require creating dashboards or manually filtering multiple reports. AI can shorten that process by helping teams locate information, generate report views, and retrieve supporting context from available data.
More self-service analysis:
AI allows teams to explore available data independently, create alternate report views, and answer routine reporting questions without expanding analyst workload.
Better visibility into change:
Static reports show current values but do not always highlight movement over time. Features such as Predictive AI analytics ,anomaly detection, and trend monitoring help identify changes that may require further review.
Higher product adoption:
Reporting tools tend to see more regular use when they are integrated directly into the product rather than introduced separately. AI expands the ways people can work with reports, reducing reliance on predefined navigation and making reporting accessible to a wider set of users.
AI-Powered Analytics Features You Can Embed
AI-powered embedded analytics can introduce different AI functions depending on where reports appear and how people are expected to work with them. The features below describe common ways AI extends reporting beyond static dashboards and fixed report structures.
White-labeled dashboards
White-labeled embedded dashboards allow reports and visualizations to match the surrounding product instead of appearing as a separate reporting interface. Organizations can configure branding elements such as colors, typography, navigation patterns, layout structure, logos, and custom domains.
Dashboards can also be organized differently across teams, customers, or tenants while preserving a consistent report foundation. This allows report access and presentation to vary without rebuilding dashboards for each deployment.
Conversational widgets
Conversational analytics introduces a question-based interface for working with reports and dashboards. Instead of navigating predefined report paths, people can begin with written requests that are interpreted against available data and report definitions.
Responses may include charts, tables, summaries, calculated values, or comparison views depending on the structure of the available data.
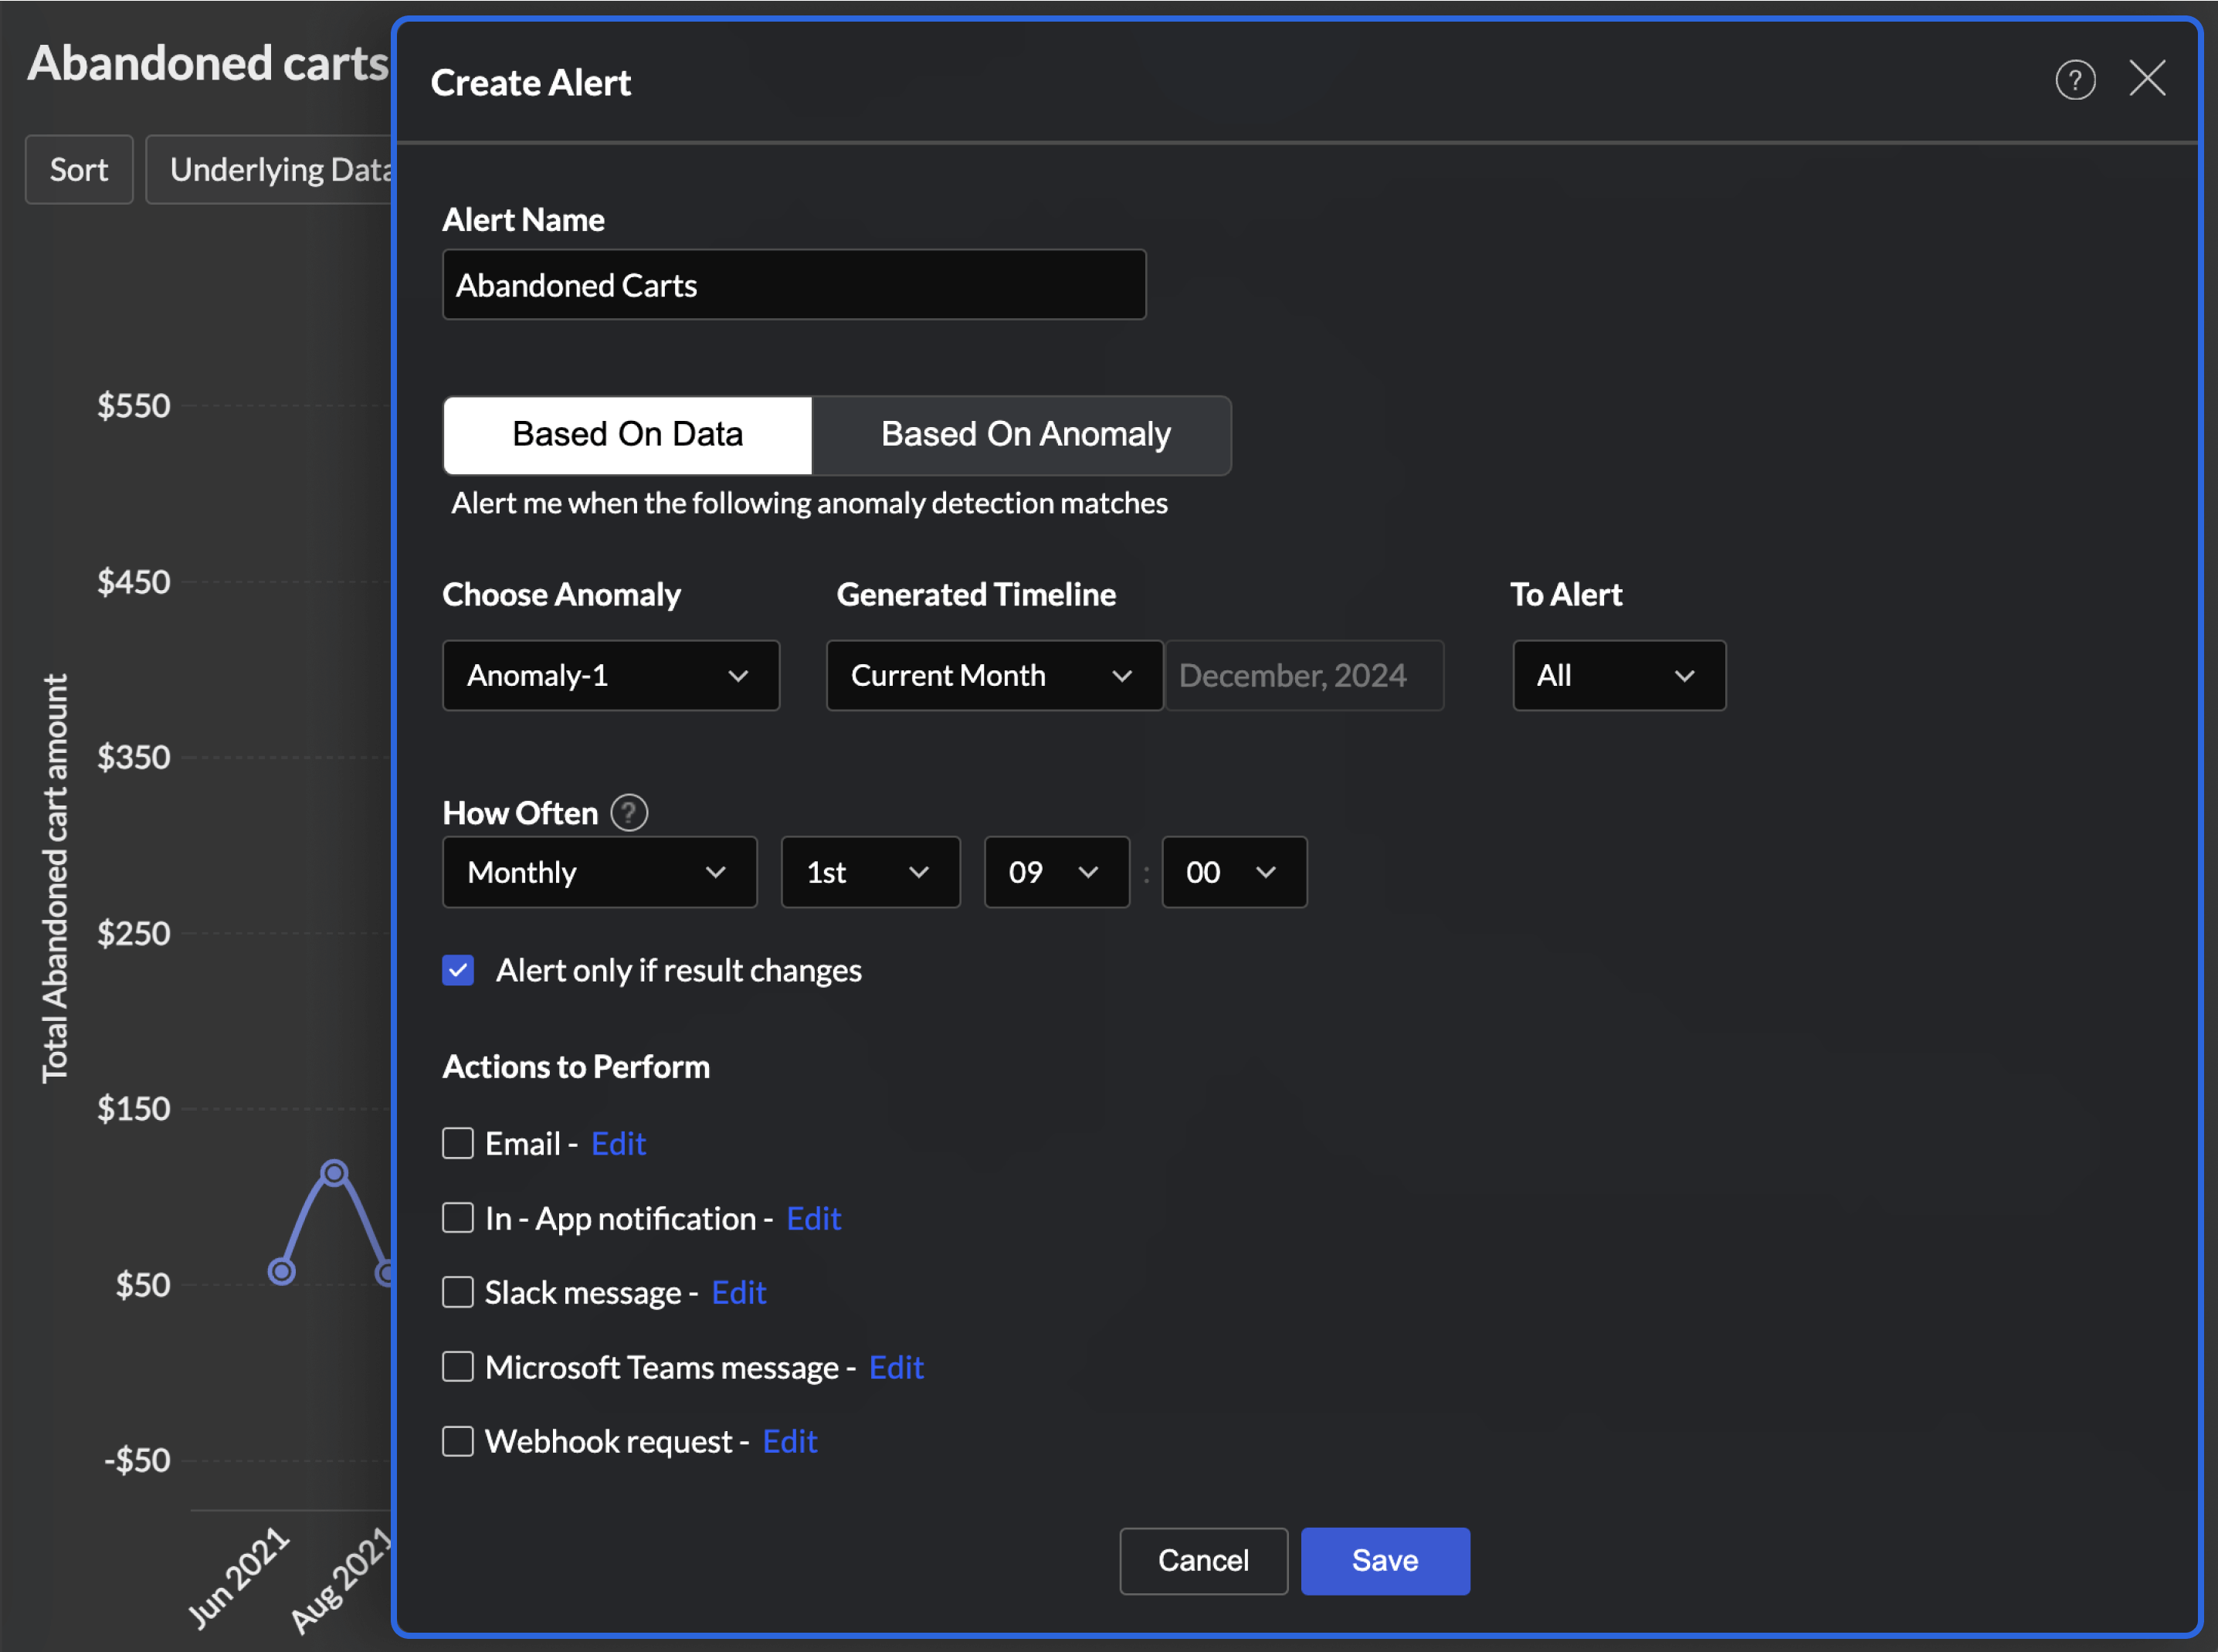
Smart alerts
Smart alerts add monitoring directly to reports by evaluating selected measures against configured conditions. Rather than depending entirely on scheduled review cycles, alerts allow changes to be identified automatically as data updates.
Alerts can be configured around thresholds, scheduled checks, detected variation, or business-specific conditions. Notifications may appear inside reports or trigger external communication depending on configuration.
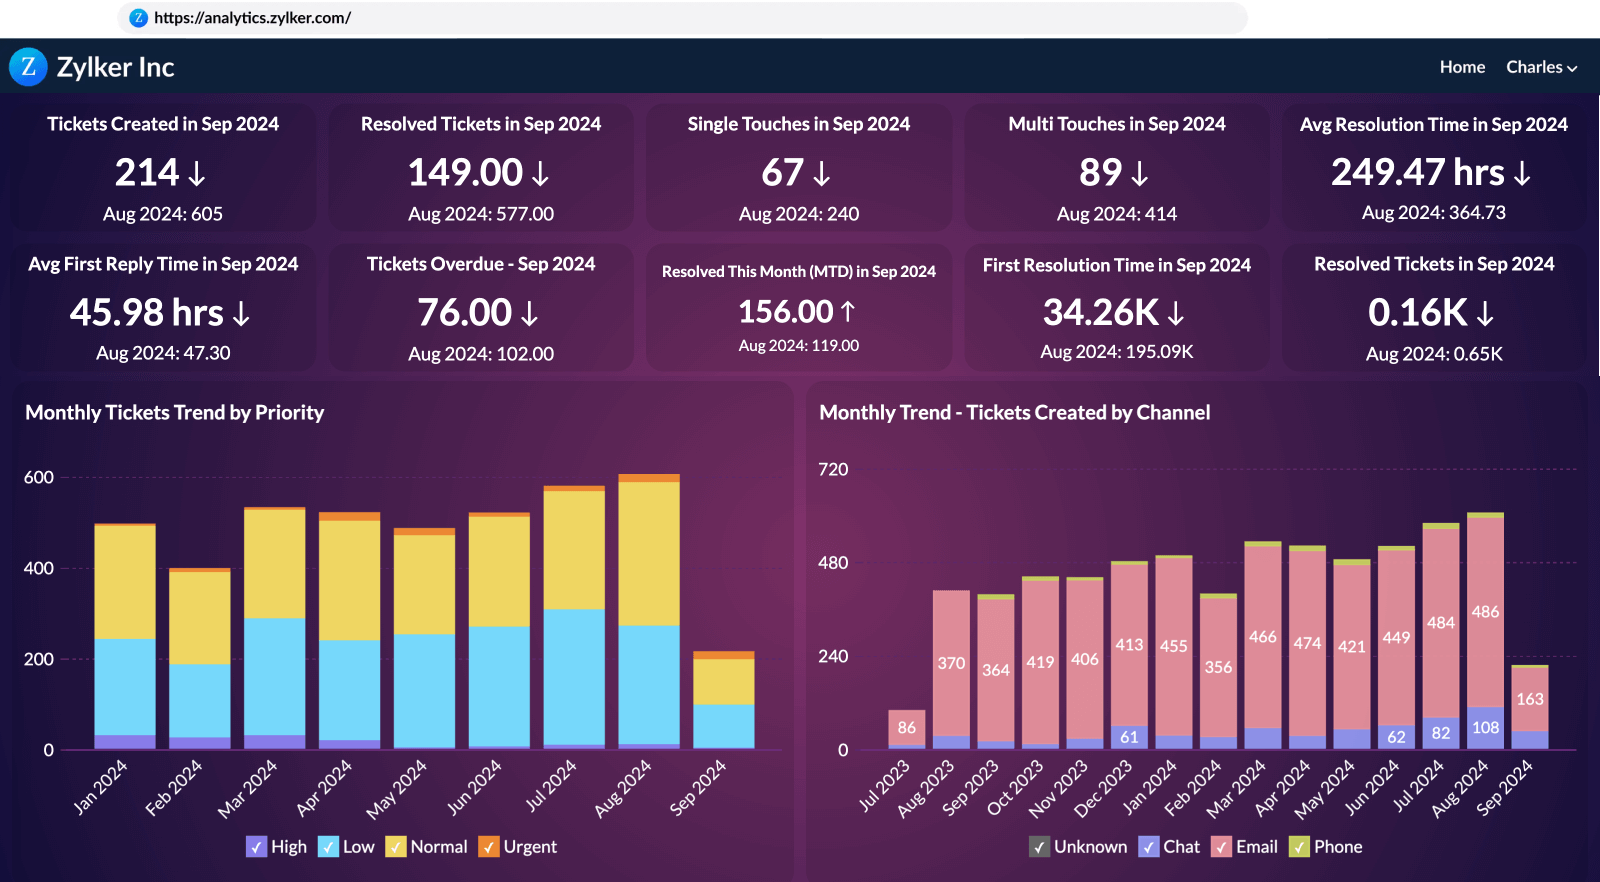
Generated narratives
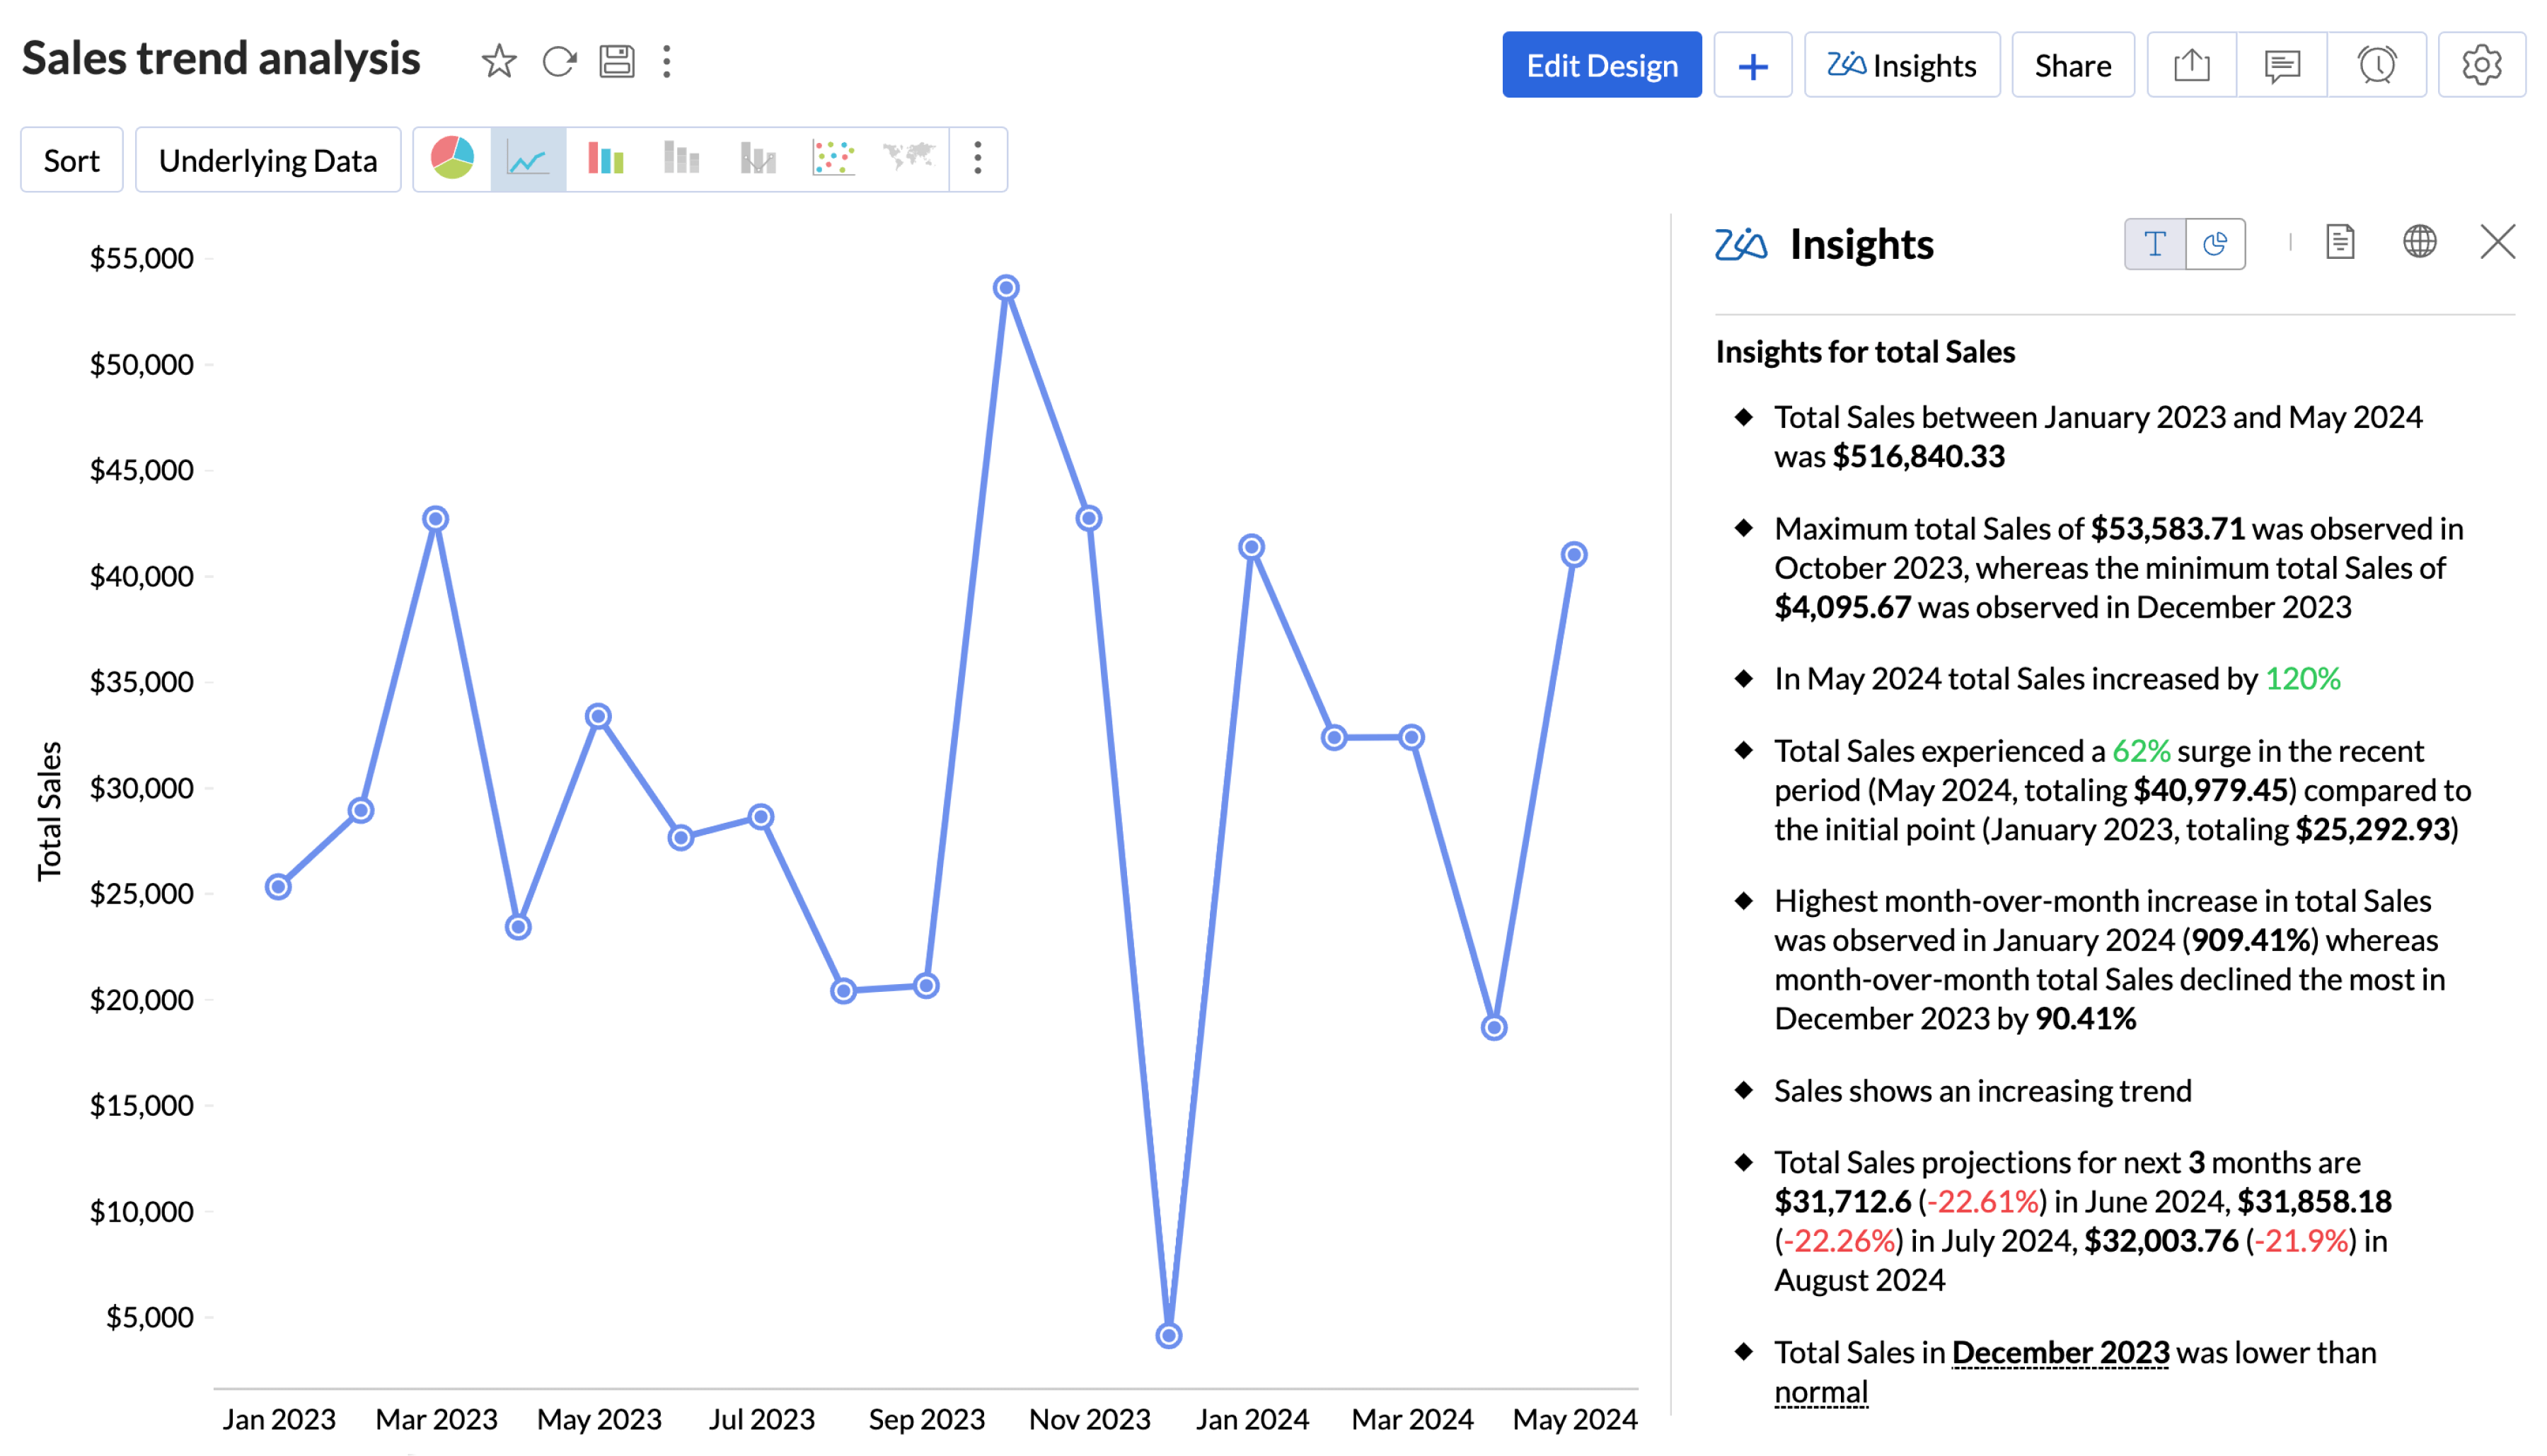
Create written explanations that appear alongside reports and dashboards. Instead of relying only on visual interpretation, narratives convert reported values and observed changes into readable summaries.
Narratives are built from available measures and comparisons and update as report outputs change. They provide additional context where charts alone may not fully explain movement in the data.
AI-powered embedded analytics platform: Zoho Analytics
Once AI functions are identified, the next step is choosing how they will be introduced into reports and maintained over time. Zoho Analytics combines embedded reporting, AI-assisted analysis, and deployment options that support both customer-facing and internal reporting use cases.
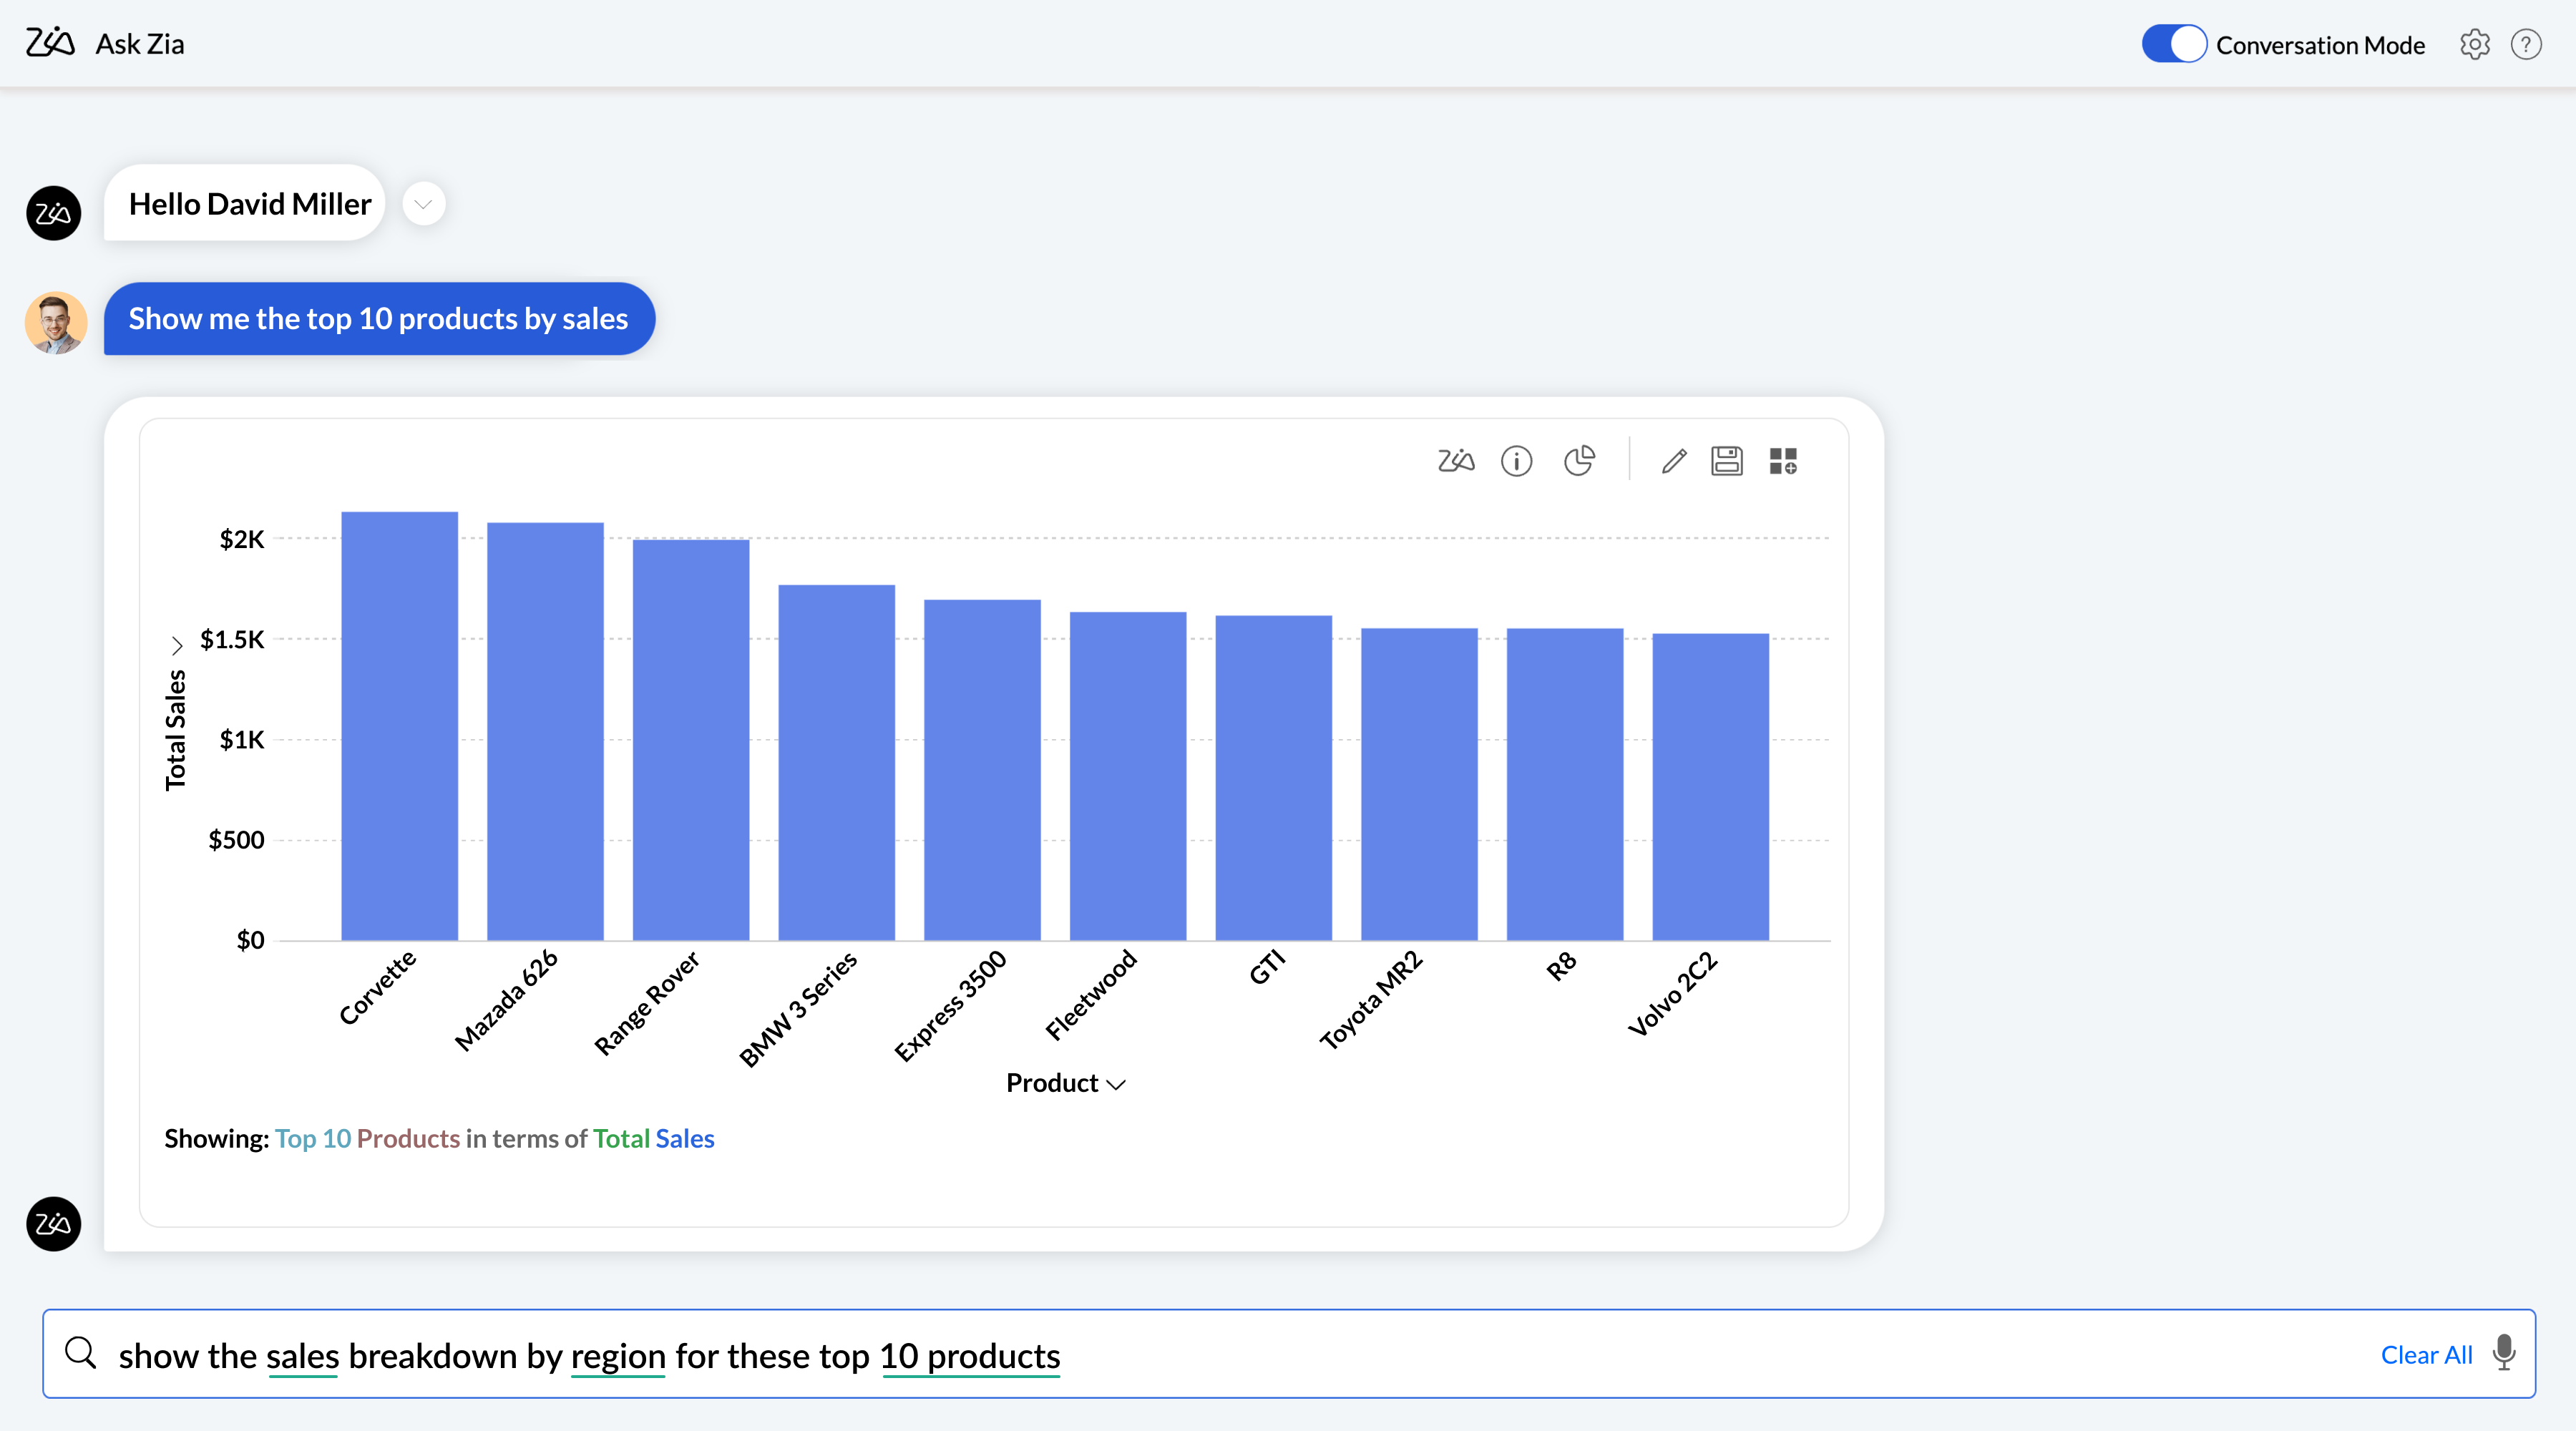
Ask Zia
Ask Zia allows people to interact with reports using written questions instead of navigating dashboards manually. Questions can return charts, tables, KPI summaries, generated report views, or follow-up exploration depending on available data and access permissions. Administrators can control which datasets and reports are available through Ask Zia to align responses with reporting requirements.

Narrative summaries
Zoho Analytics can generate written summaries alongside reports and dashboards to explain reported values and observed changes. Summaries are created from available report data and update as report outputs change. They can be configured across different dashboards to provide additional explanation where visual reporting alone may not provide enough context.

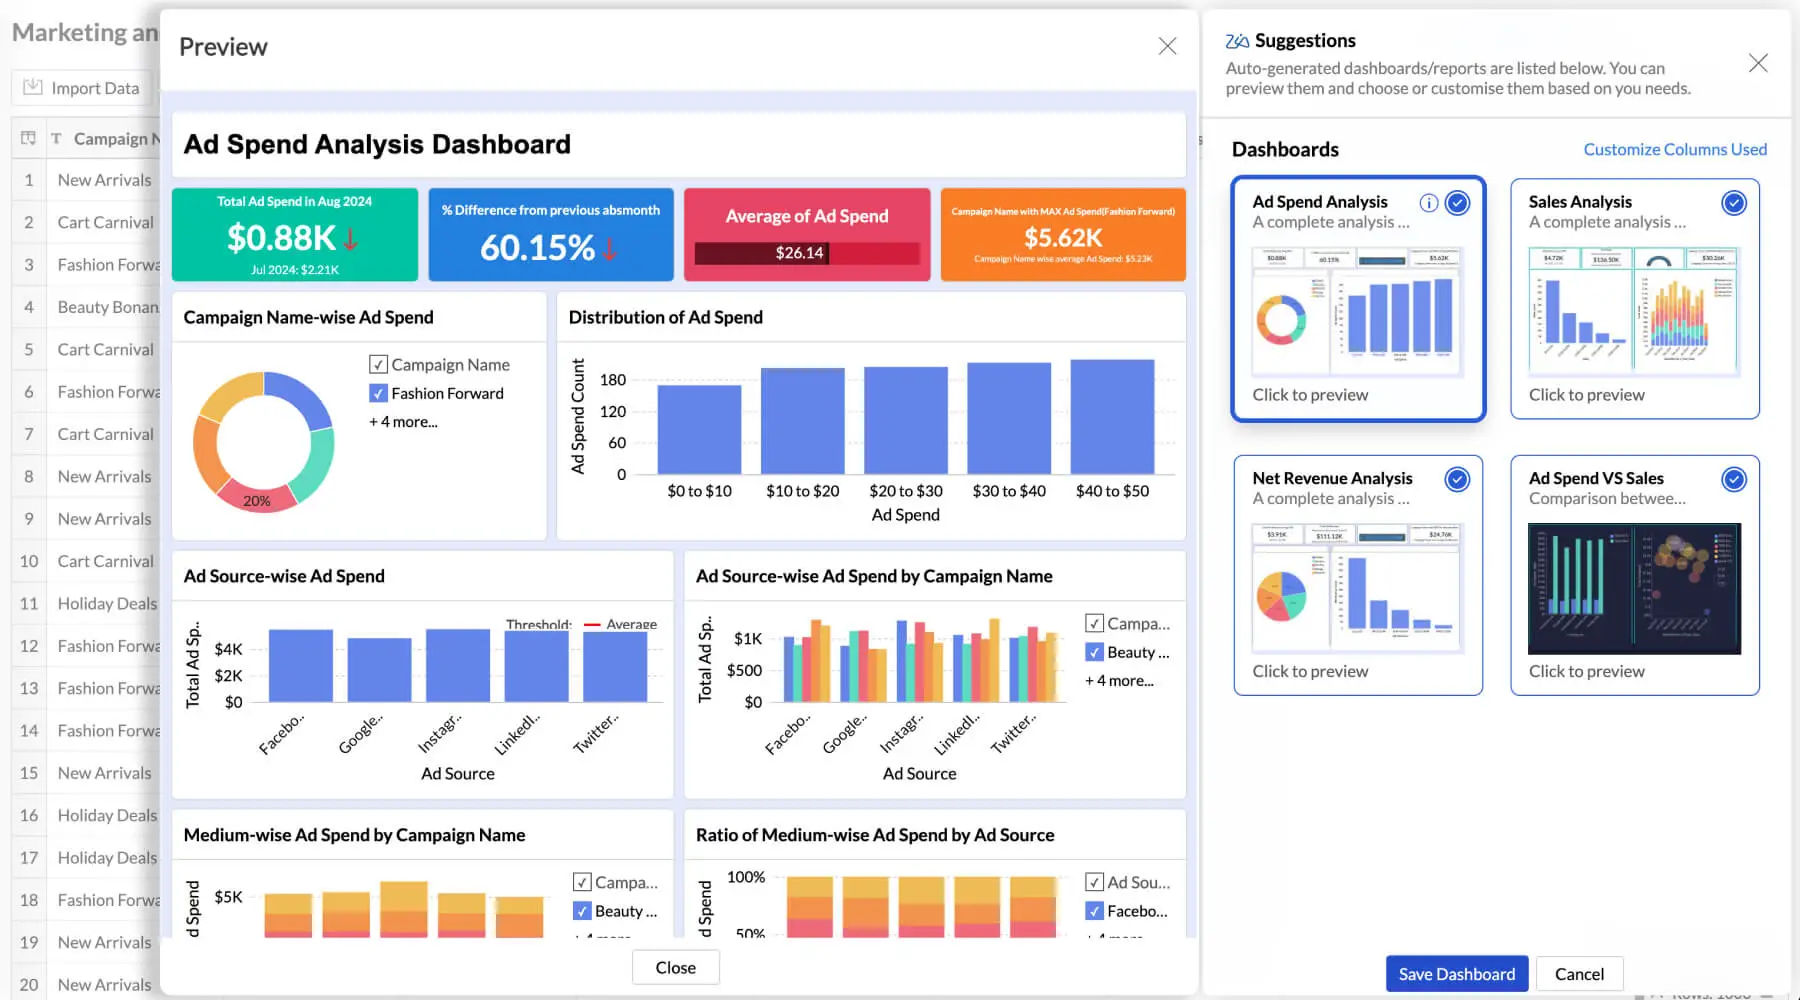
Report recommendations
Zoho Analytics can generate reports and dashboard layouts automatically by interpreting connected datasets and identifying relationships across available fields.Suggested outputs may include grouped measures, recommended chart formats, and initial dashboard layouts that can be adjusted after generation. This reduces the amount of manual setup required before reports become usable.

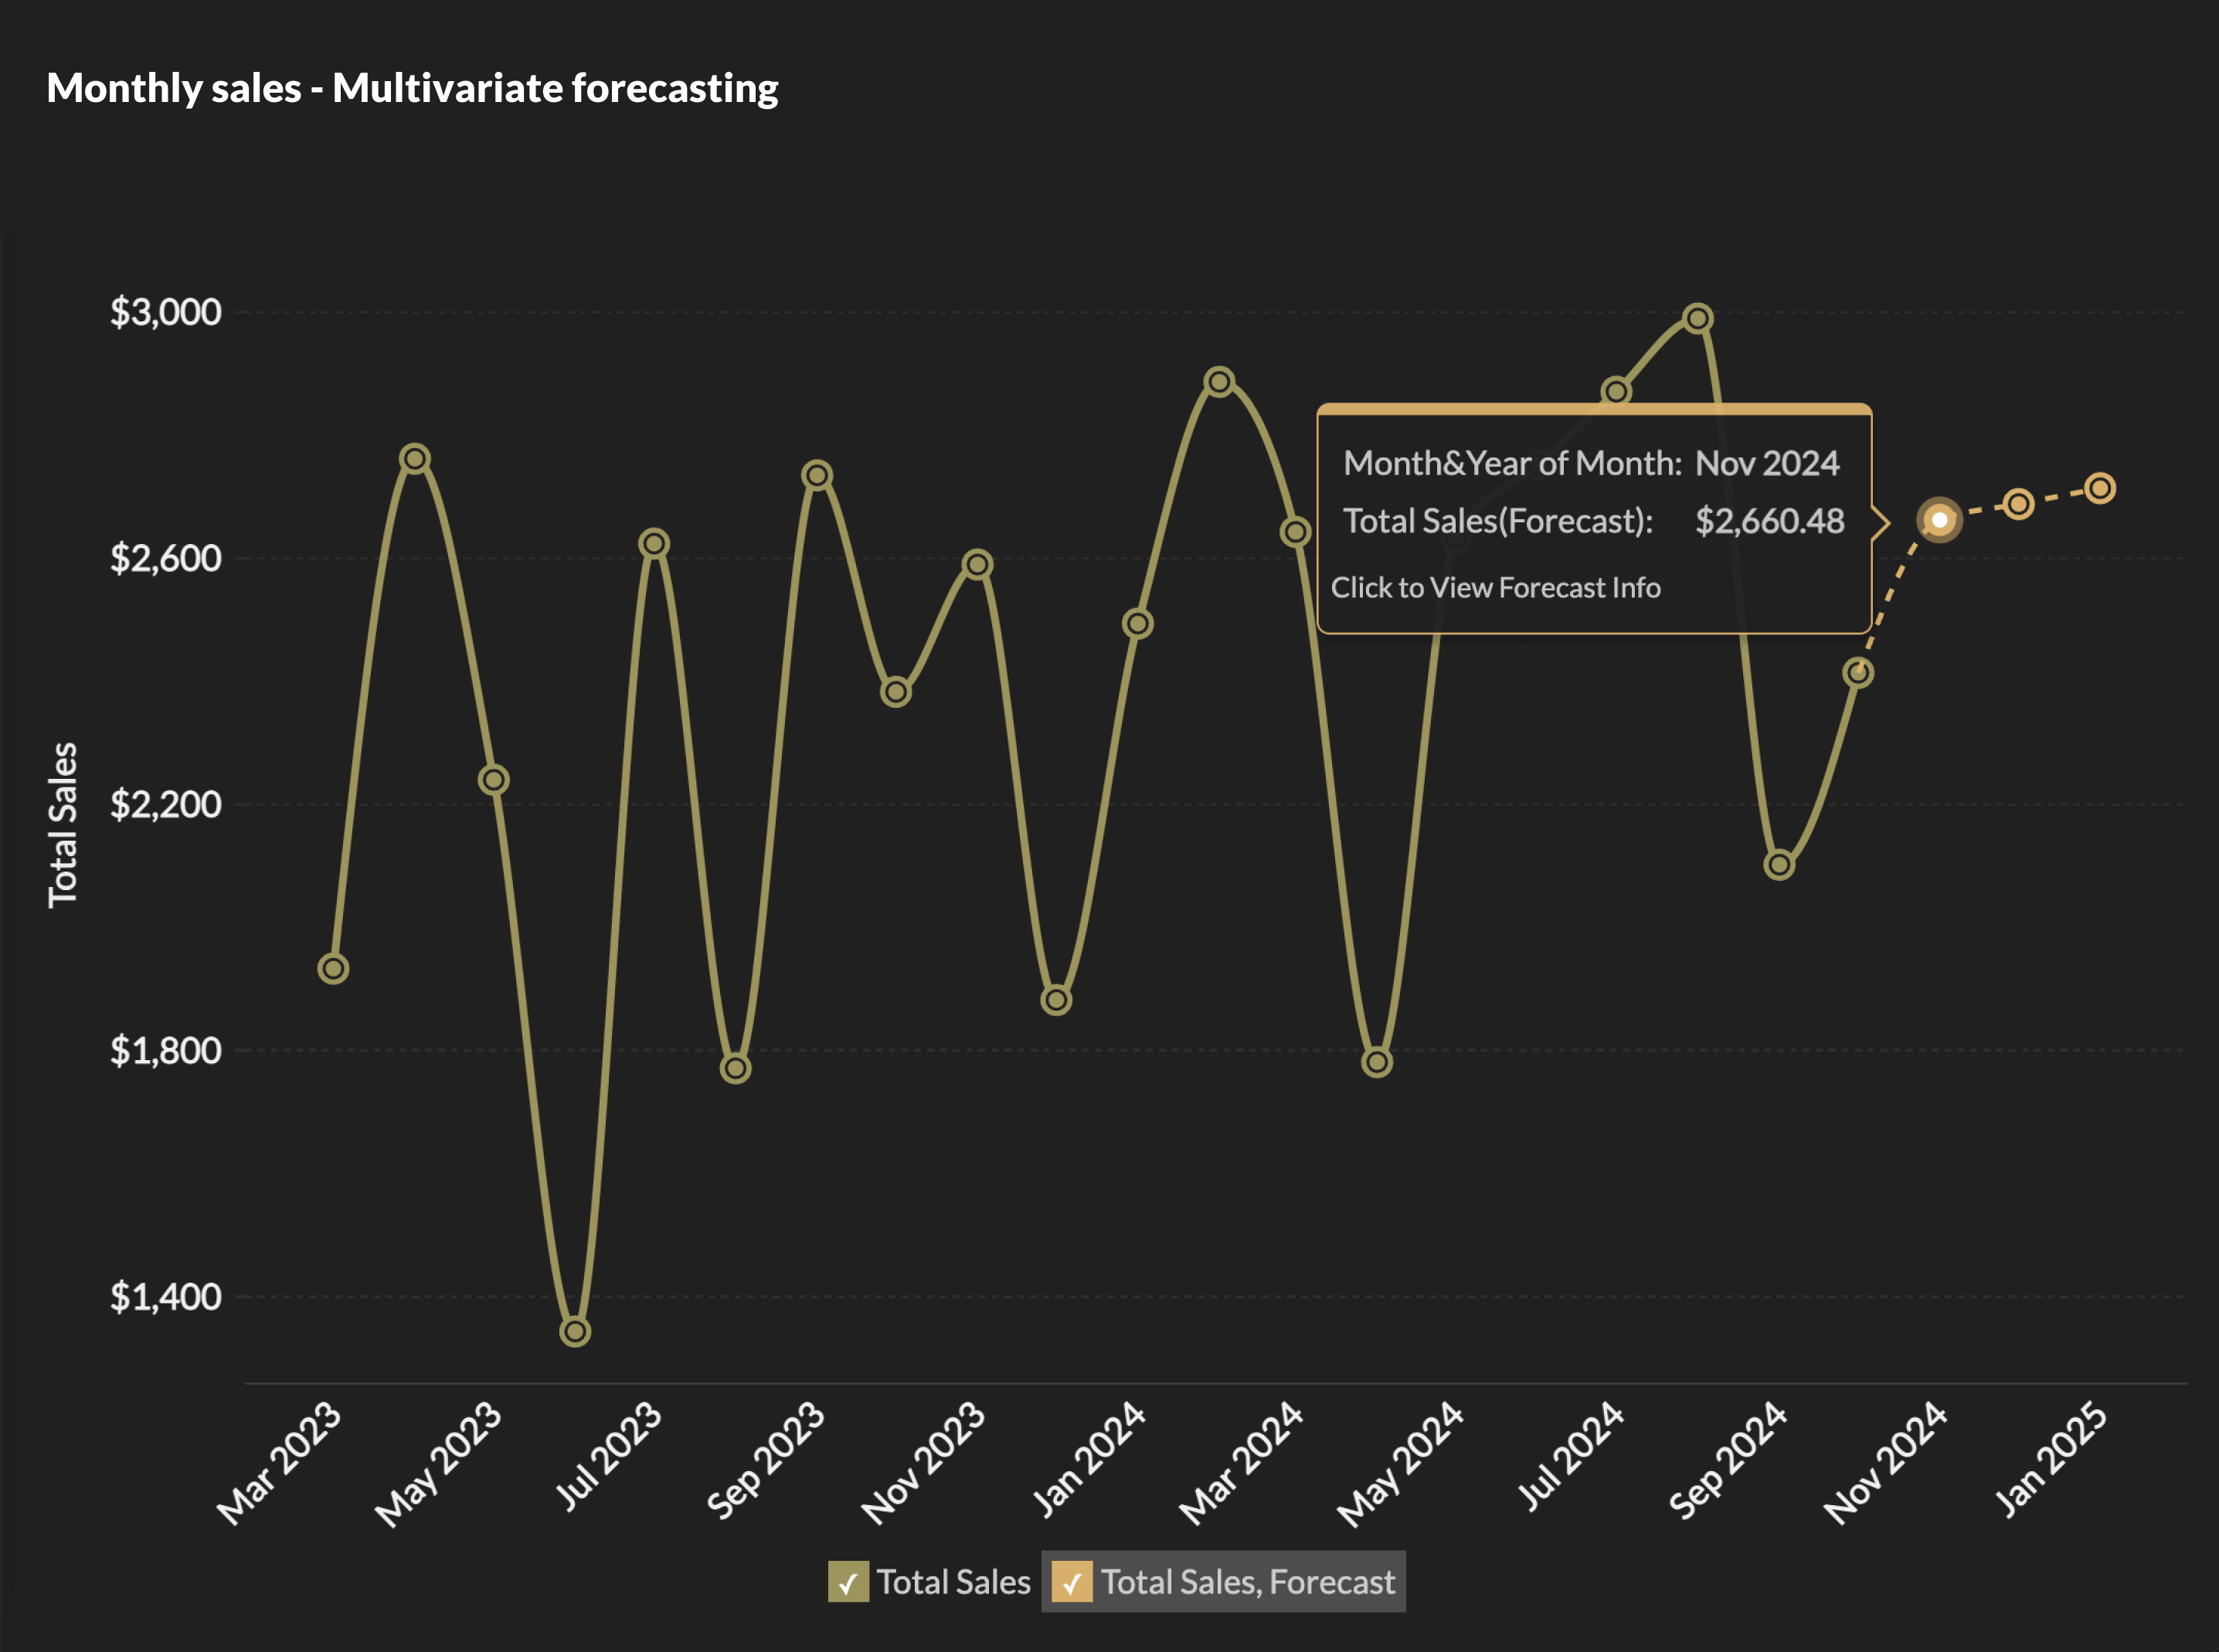
Forecast configuration
Forecasts can be created directly within reports using historical data and configurable reporting intervals. Configuration options determine forecast periods, selected measures, comparison views, and how projected values appear alongside historical reporting. Forecast settings can be adjusted independently across different reports and dashboards.
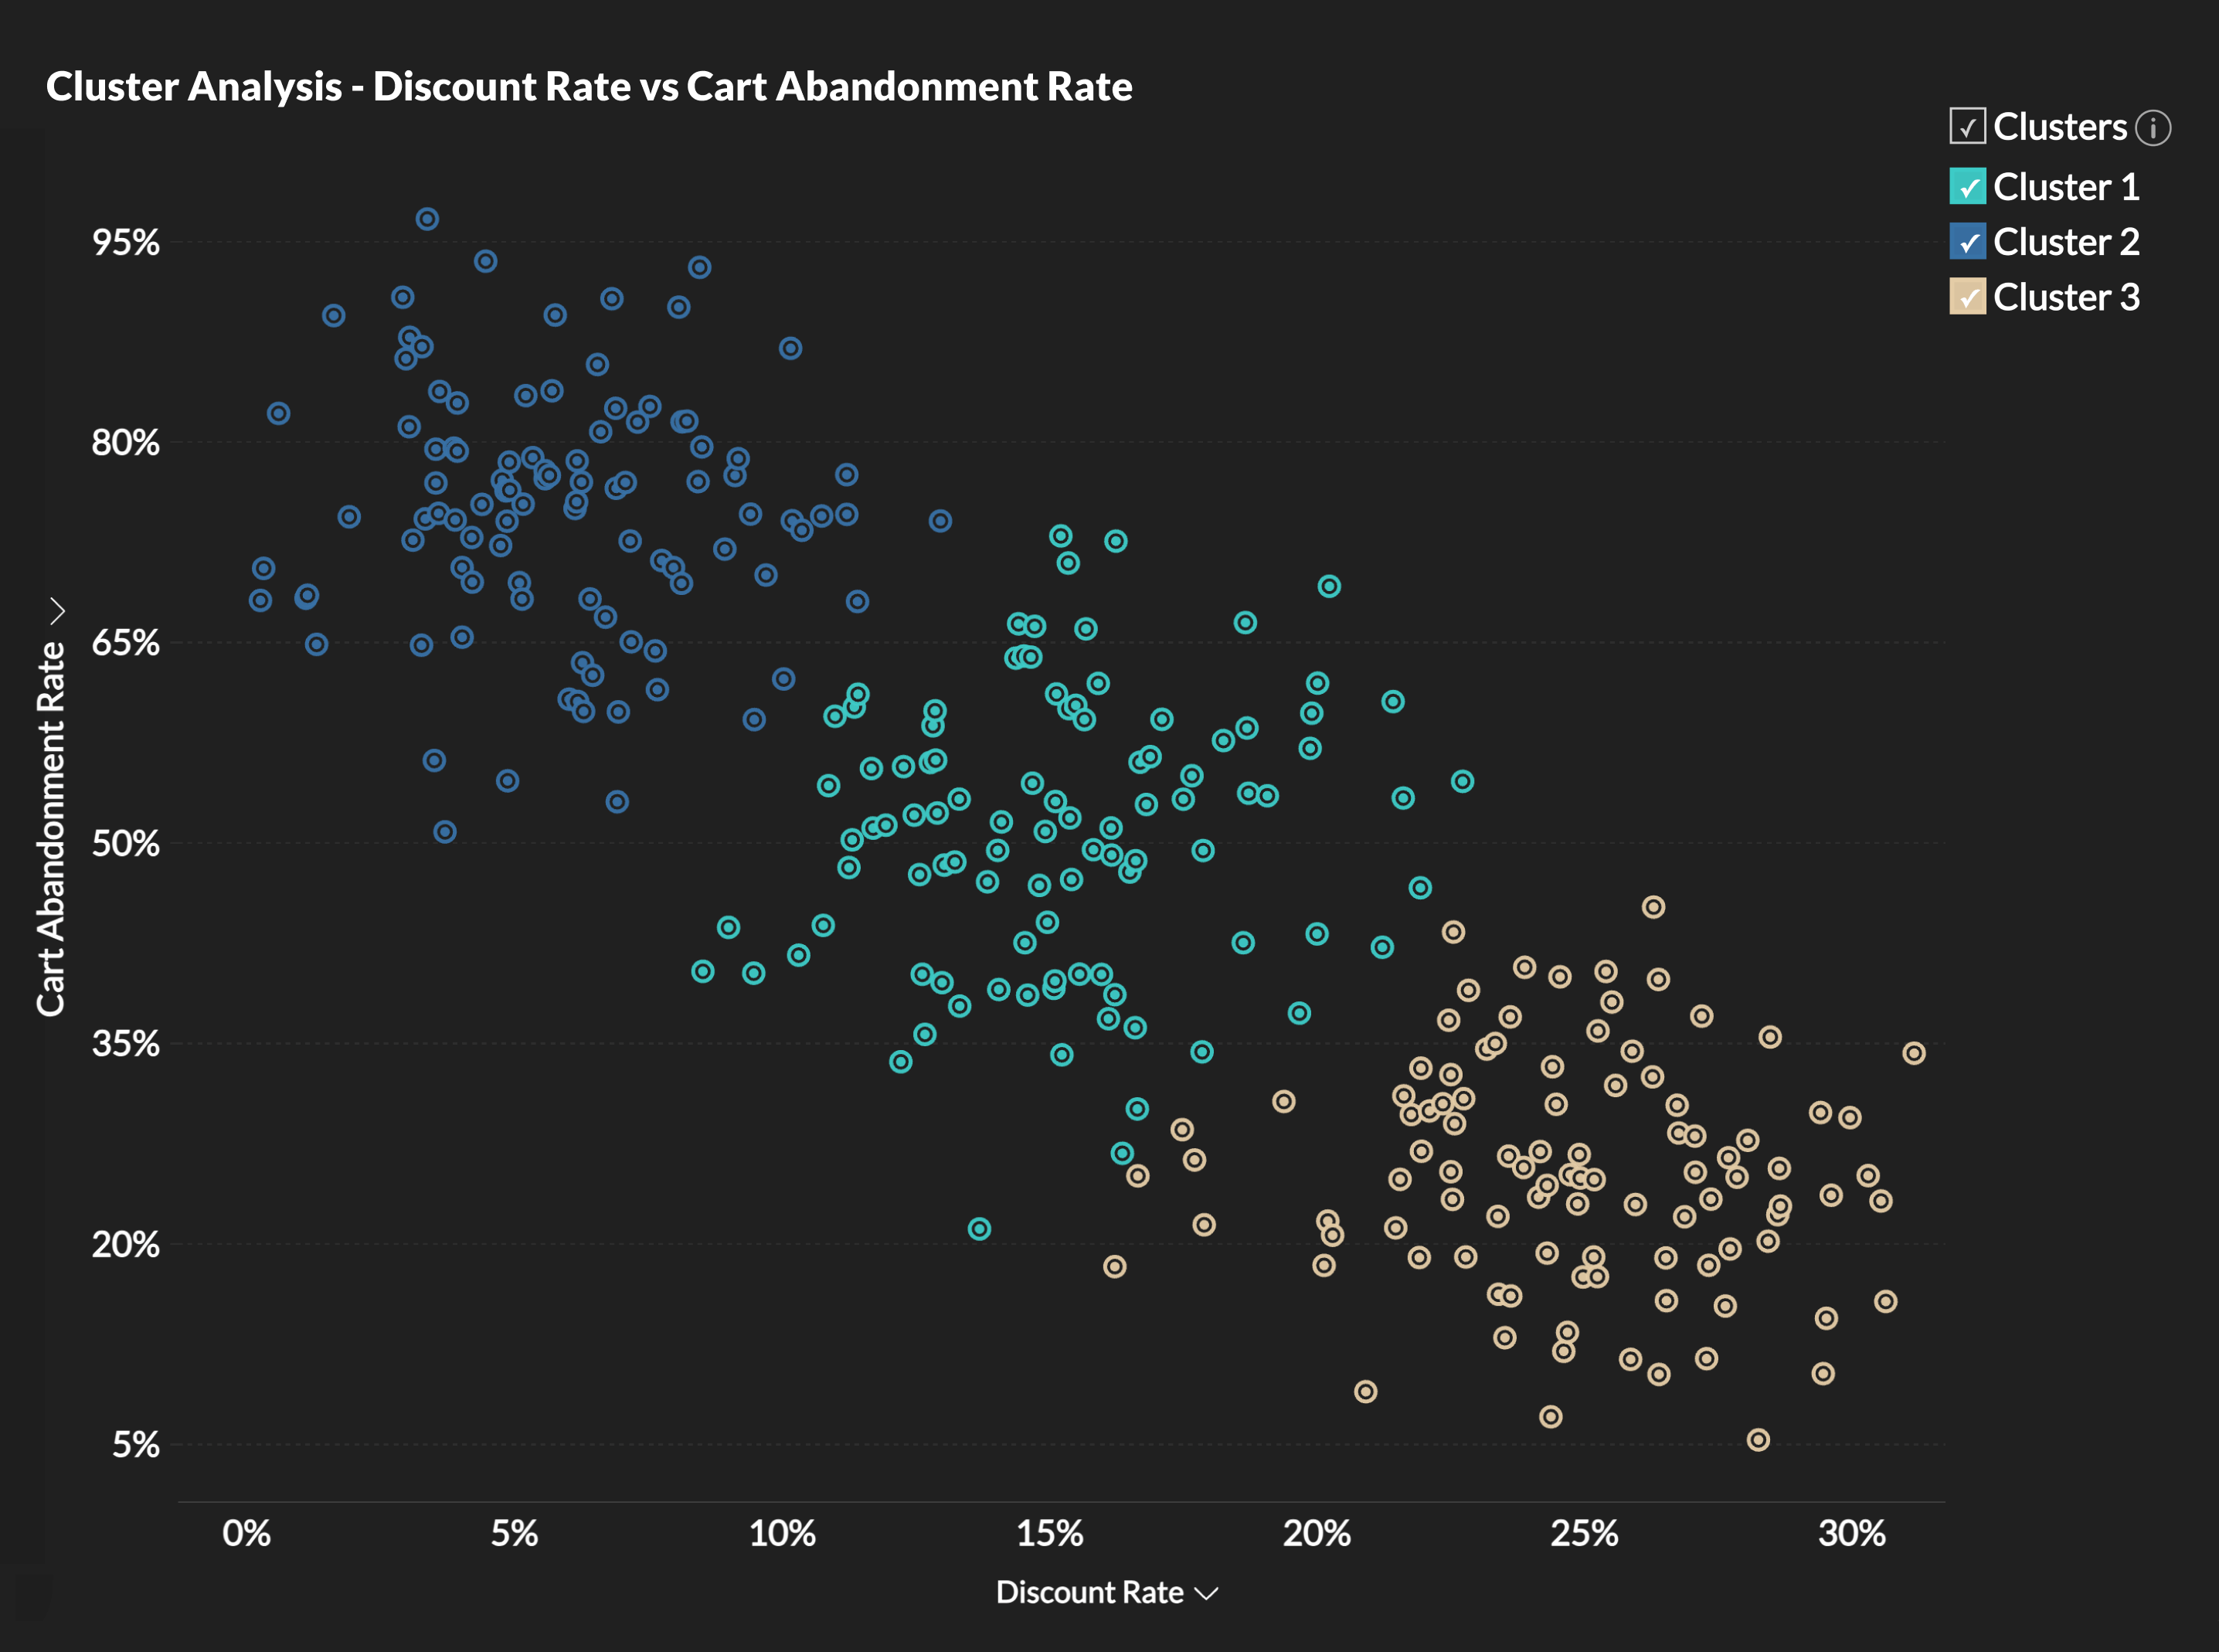
Segmentation models
Zoho Analytics supports clustering models that group records based on shared characteristics across selected attributes. Generated segments can be reused across reports and dashboards to support comparison and organization of reporting outputs. Segment definitions remain configurable depending on reporting requirements.
Deployment controls
A data analytics software like Zoho Analytics provides configuration options for branding, authentication, embedding methods, report access, and tenant separation. These settings determine how reports are introduced across customer-facing products and internal applications while maintaining consistent access and administrative controls across deployments.

Real-world Examples of Embedded Analytics Powered by AI
AI-powered embedded analytics appears differently depending on where reporting is introduced and who uses it. The examples below show how AI functions are applied in different product contexts.
SaaS Platforms
Many SaaS products introduce reporting directly into customer-facing interfaces rather than offering separate analytics tools(Know more about embedded analytics for SaaS). Examples include
- Organizing reports for different customer accounts and tenants/li>
- Exposing dashboards directly within product interfaces
- Allowing customers to retrieve report views through written questions
- Generating reports from product and usage data
Customer Portals
Customer-facing reporting often focuses on giving account holders direct access to information relevant to their usage, activity, or business relationship. Common examples include:
- Reviewing account performance and historical activity
- Comparing usage trends across reporting periods
- Accessing customer-specific reports and dashboard views
- Generating written summaries to explain reported changes
Internal Business Tools
Internal applications often combine reporting with operational activities, making analytics part of day-to-day review rather than a separate reporting process. Examples include:
- Monitoring sales performance and pipeline movement from internal business systems
- Tracking workforce metrics across departments
- Viewing financial and operational reports from centralized dashboards
- Retrieving additional report context through written requests
Operational Systems
Operational reporting typically requires continuous review of changing values rather than periodic report generation. Common examples include:
- Tracking inventory movement across locations
- Monitoring delivery performance against historical values
- Identifying unusual changes across operational measures
- Reviewing exception reports generated from monitored conditions
How to Embed AI Powered Analytics for your Business needs?
Step-1: Connect your data
Connect Zoho Analytics to the systems your business already uses. That may include databases, cloud applications, data warehouses, or internal APIs. Zoho Analytics supports native connectors and custom API-based ingestion for sources such as Salesforce, Google BigQuery, MySQL, and internal systems. Data quality matters at this stage because forecasting, summaries, and other AI outputs depend on the underlying data.
Step-2: Build reports and dashboards
Create reports manually with the report builder or generate an initial dashboard from the available data structure. Zoho Analytics can detect fields, relationships, and metrics to create charts and KPI views automatically. Teams can then edit layouts, organize reports, and create dashboards for different user groups.
Step-3: Enable AI features
Turn on the AI features that fit the application workflow. That may include Ask Zia for natural-language queries, generated summaries, anomaly detection, forecasting, or clustering. Features can be enabled by workspace and configured based on user access requirements.
Step-4: Customize the experience
Apply branding controls such as colors, fonts, logos, and custom domains so analytics appears as part of the existing user experience. Configure user permissions and multi-tenant access where needed so different users or customers only see the reports assigned to them.
Step-5: Embed analytics into the application
Use Zoho Analytics Embed API to generate secure embed links and load reports inside the application interface through iframe or SDK options. Authentication can be handled through SSO or token-based access. Embedded views continue to reflect current data as refresh schedules or live updates run in the background.
What to Consider Before Embedding AI-Powered Analytics
Successful implementation depends on data readiness, governance, deployment controls, and user access design.
Data Integration
Seamless integration across your data sources and ensuring your data is clean, well-structured, and easily accessible is essential for delivering high-quality, AI-driven insights. A platform like Zoho Analytics offers a comprehensive data management framework with 500+ data connectors and end-to-end pipelines for data preparation.
Explainable AI
While AI can identify predictions and anomalies, business users may hesitate to trust insights without understanding the "why." Prioritize platforms like Zoho Analytics that provide explainable outputs, explaining both the "what" and the "why" behind data patterns.
Customization & Control
Look for white-labeling and customization features that let you fully align embedded analytics with your brand identity across the UI, domain, and overall user experience.
Platform Management
Select a platform with strong data governance, role-based access control, SSO, and multi-tenant architecture to ensure enterprise-grade scalability, security, and compliance when handling sensitive business data.
Why Choose Zoho Analytics for AI-powered Embedded Analytics?
After identifying the requirements for AI-powered embedded analytics, the next step is evaluating whether the platform can support them in practice.
Zoho Analytics is a modern AI analytics software that combines embedded reporting, AI-assisted analysis, deployment controls, and white-label customization in a single environment. Teams can configure dashboards, conversational interfaces, forecasting models, and reporting access across customer-facing products and internal applications without building each capability independently.
The platform also supports data governance, multi-tenant deployment, authentication controls, and flexible embedding approaches to support different implementation requirements.
Frequently asked questions
What is AI-powered embedded analytics?
- Embedded analytics places reporting directly inside an application instead of requiring users to move into a separate BI tool. AI extends that experience by helping people explore data, identify changes, estimate trends, and receive explanations within the same interface.
How can I embed AI-powered analytics into my application?
- To embed AI-powered analytics into your application, choose a platform that supports embedding through iframes, APIs, or SDKs. A typical setup includes connecting data sources, building reports and dashboards, applying branding preferences, and embedding views into the product interface. Zoho Analytics supports authentication through SSO or token-based access so reporting remains connected to current source data.
What are real-world examples of AI-powered embedded analytics?
- Examples depend on how reporting is used inside the product. Common scenarios include:
- CRM platforms showing predictive lead scoring
- HR systems highlighting workforce trends
- Operations tools surfacing unusual changes in activity
- Customer portals providing dashboards and report summaries
What is the difference between embedded AI and generative AI?
- Embedded AI refers to AI capabilities that operate inside an existing product or reporting experience. Generative AI refers to models that create new outputs such as text, summaries, images, or responses. Within analytics products,automated summaries are one example of generative AI appearing inside an embedded experience.
What AI-powered embedded analytics tools should I consider in 2026?
- The right platform depends more on reporting requirements than feature counts alone.When comparing options, review:
- Embedding methods
- Access and authentication controls
- Branding and white-label options
- Reporting flexibility
- Available AI functions
- Pricing and deployment model
- Commonly evaluated platforms include Zoho Analytics, Tableau Embedded Analytics, Sisense, Qlik, and Luzmo.
How does AI improve decision-making inside embedded reports?
- Identifying unusual movement across metrics
- Estimating future values from historical patterns
- Generating written explanations alongside reports
- Helping users with faster retrieval of information
AI changes reporting by reducing the amount of manual review required to interpret changing data. Examples include:
What should I consider before embedding AI-powered analytics?
- Data quality
- Forecasts, summaries, and anomaly detection depend on clean and reliable data sources. Confirm refresh schedules and data consistency before enabling AI functions.
- Review data refresh schedules to confirm that embedded views reflect current information.
- Access control
- Define permissions carefully, especially for multi-tenant environments. Authentication should align with your application’s existing access model.
- Use SSO or token-based authentication to align analytics access with your application's existing identity system.