Business intelligence: What is it and how can it benefit you
Every business deals with large amounts of data—whether it's from your everyday operations or customer information. However, what's crucial is how efficiently you use this data to improve the way you work. That's where BI comes in. It provides you with a consistent, real-time picture of what's happening with your business, so that you can derive insights, take necessary actions, and make better decisions. BI can help you identify areas that need attention, navigate through uncertainties by forecasting trends or demands, and easily spot opportunities that can help your business increase sales.
Build smart applications with Zoho Creator
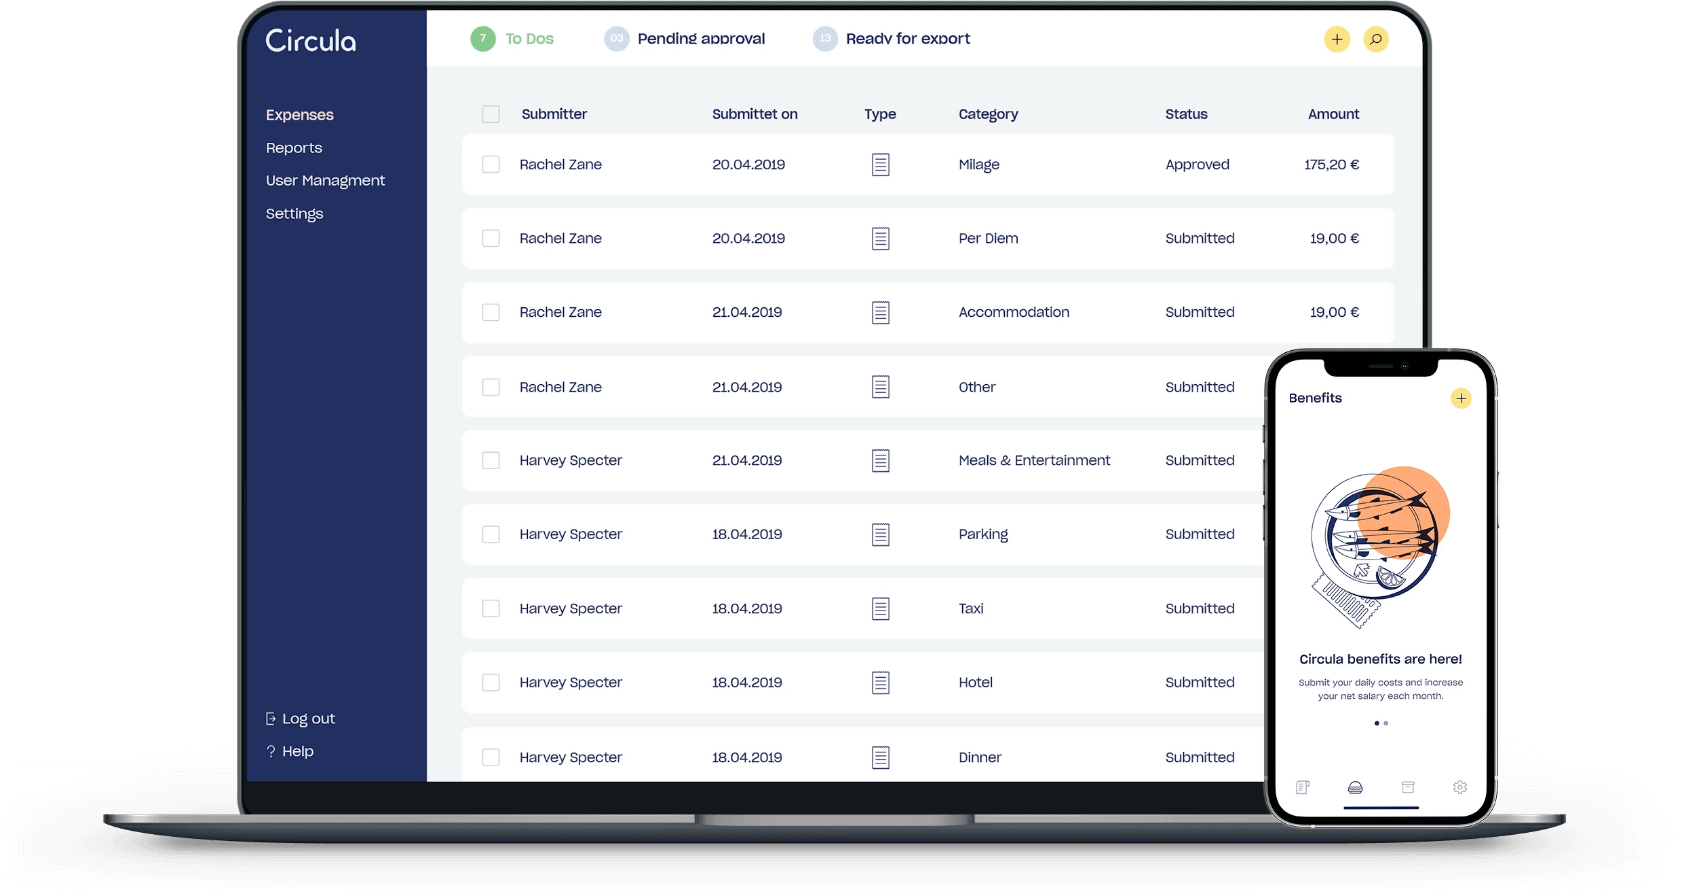
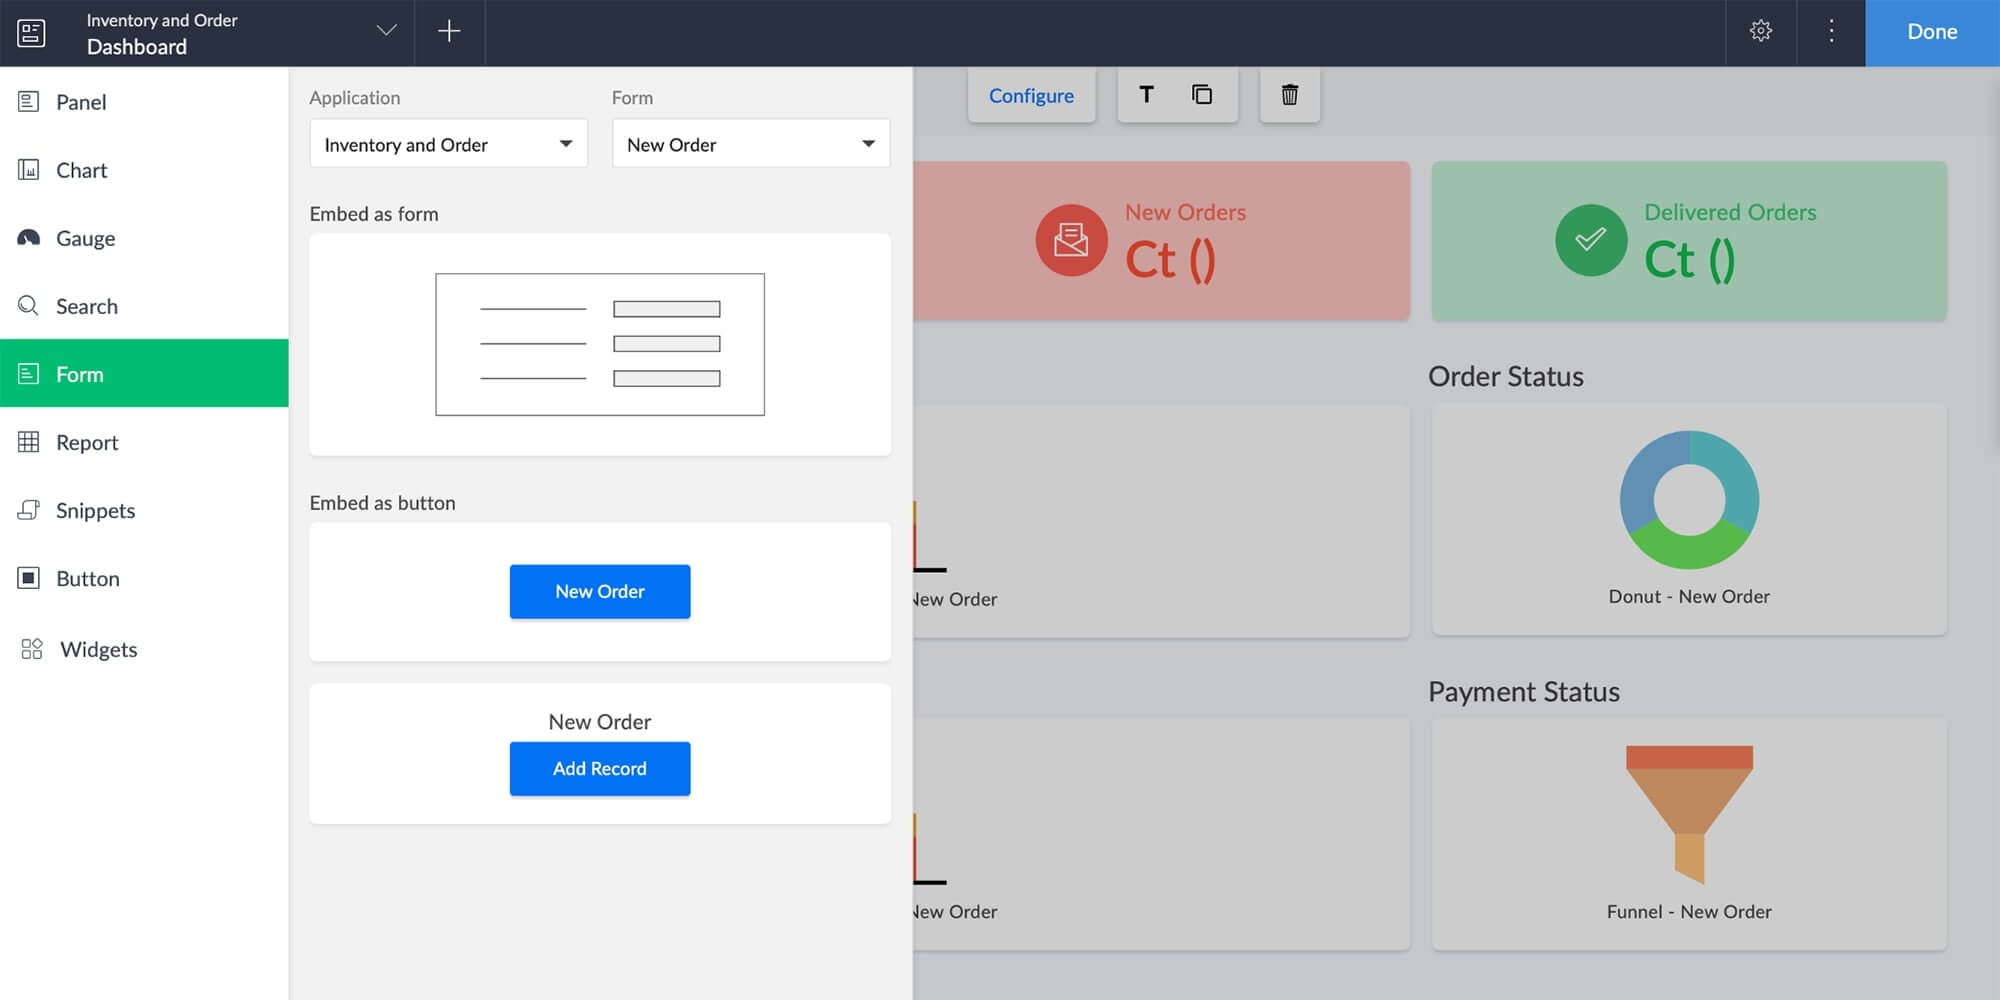
Creator's powerful BI and low-code features allow you to build comprehensive business solutions that enable you to gain insights on real-time information and automate tasks on the go. For example, you can create an inventory dashboard that enables on-demand ordering through the application. Watch this video to learn more.
How can BI help your business stay competitive?
DATA VISUALIZATIONS
Make data analysis fast and easy
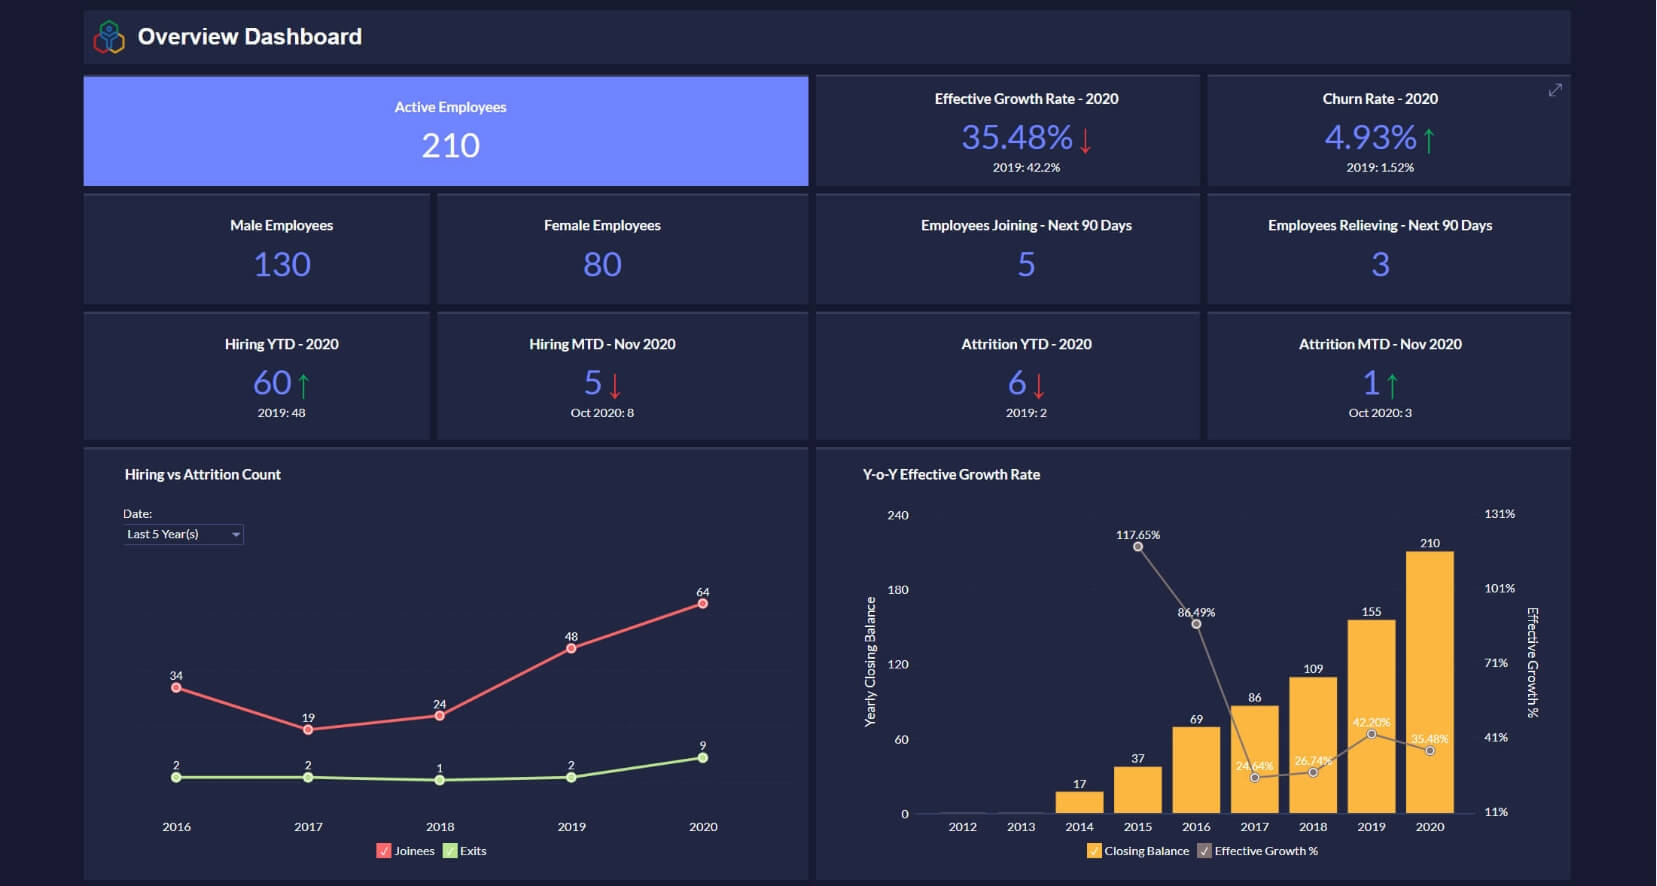
With our intuitive drag-and-drop interface, you can create interactive reports and dashboards fast. Add any number of charts, widgets, and pivot tables to make your data easy to understand and pinpoint any deviations or anomalies. You can also use HTML to add contextual information and images to enrich your dashboards.
POWERFUL INTEGRATIONS
Connect to any data source at any time
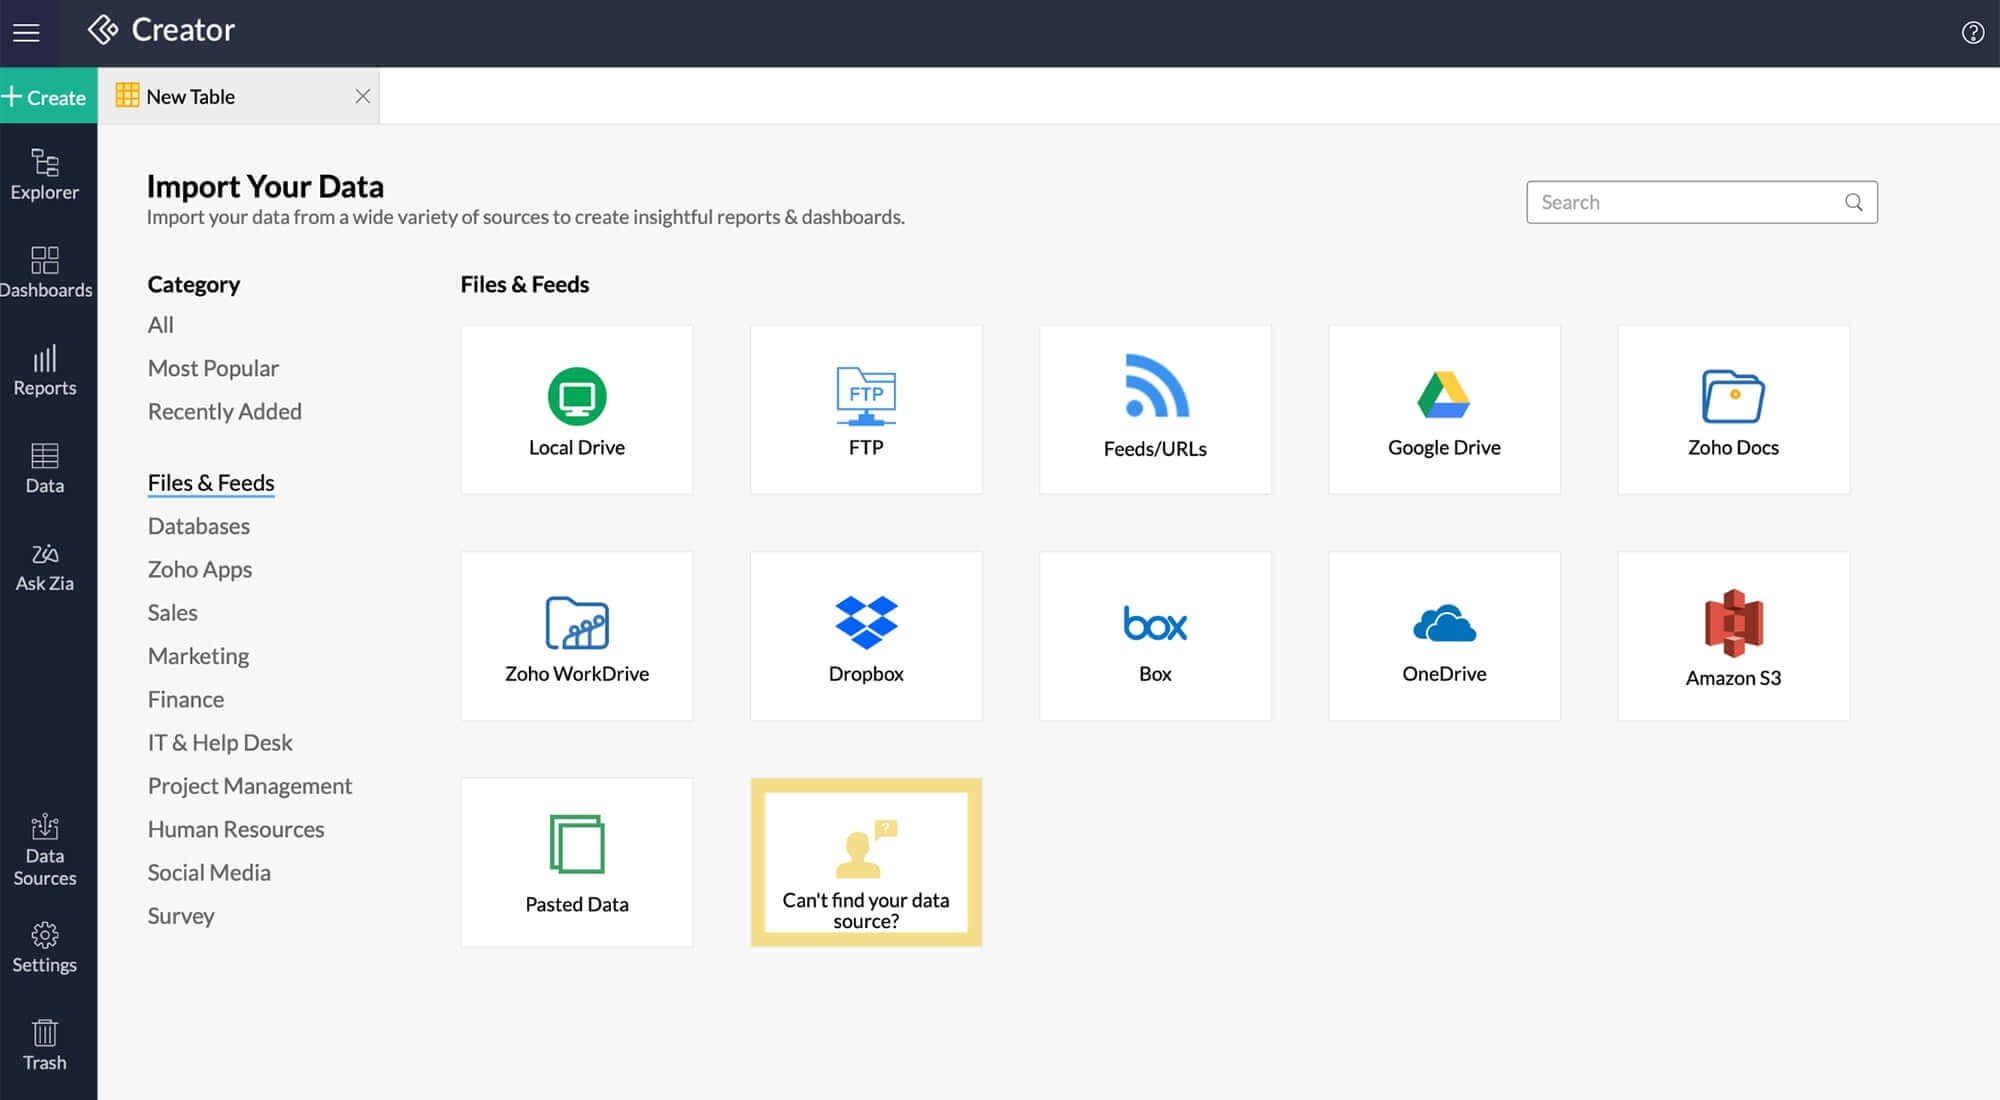
If you've got tons of disconnected data stuck in disparate systems, you can combine it under one roof to get in-depth visibility into your business processes. Upload data from spreadsheets or online storage services, like Zoho Docs, Google Drive, Dropbox, and Microsoft OneDrive, and even use APIs to extract data from MySQL servers, Oracle, or any other in-house database.
AUGEMENTED ANALYTICS
Make faster, better decisions with AI
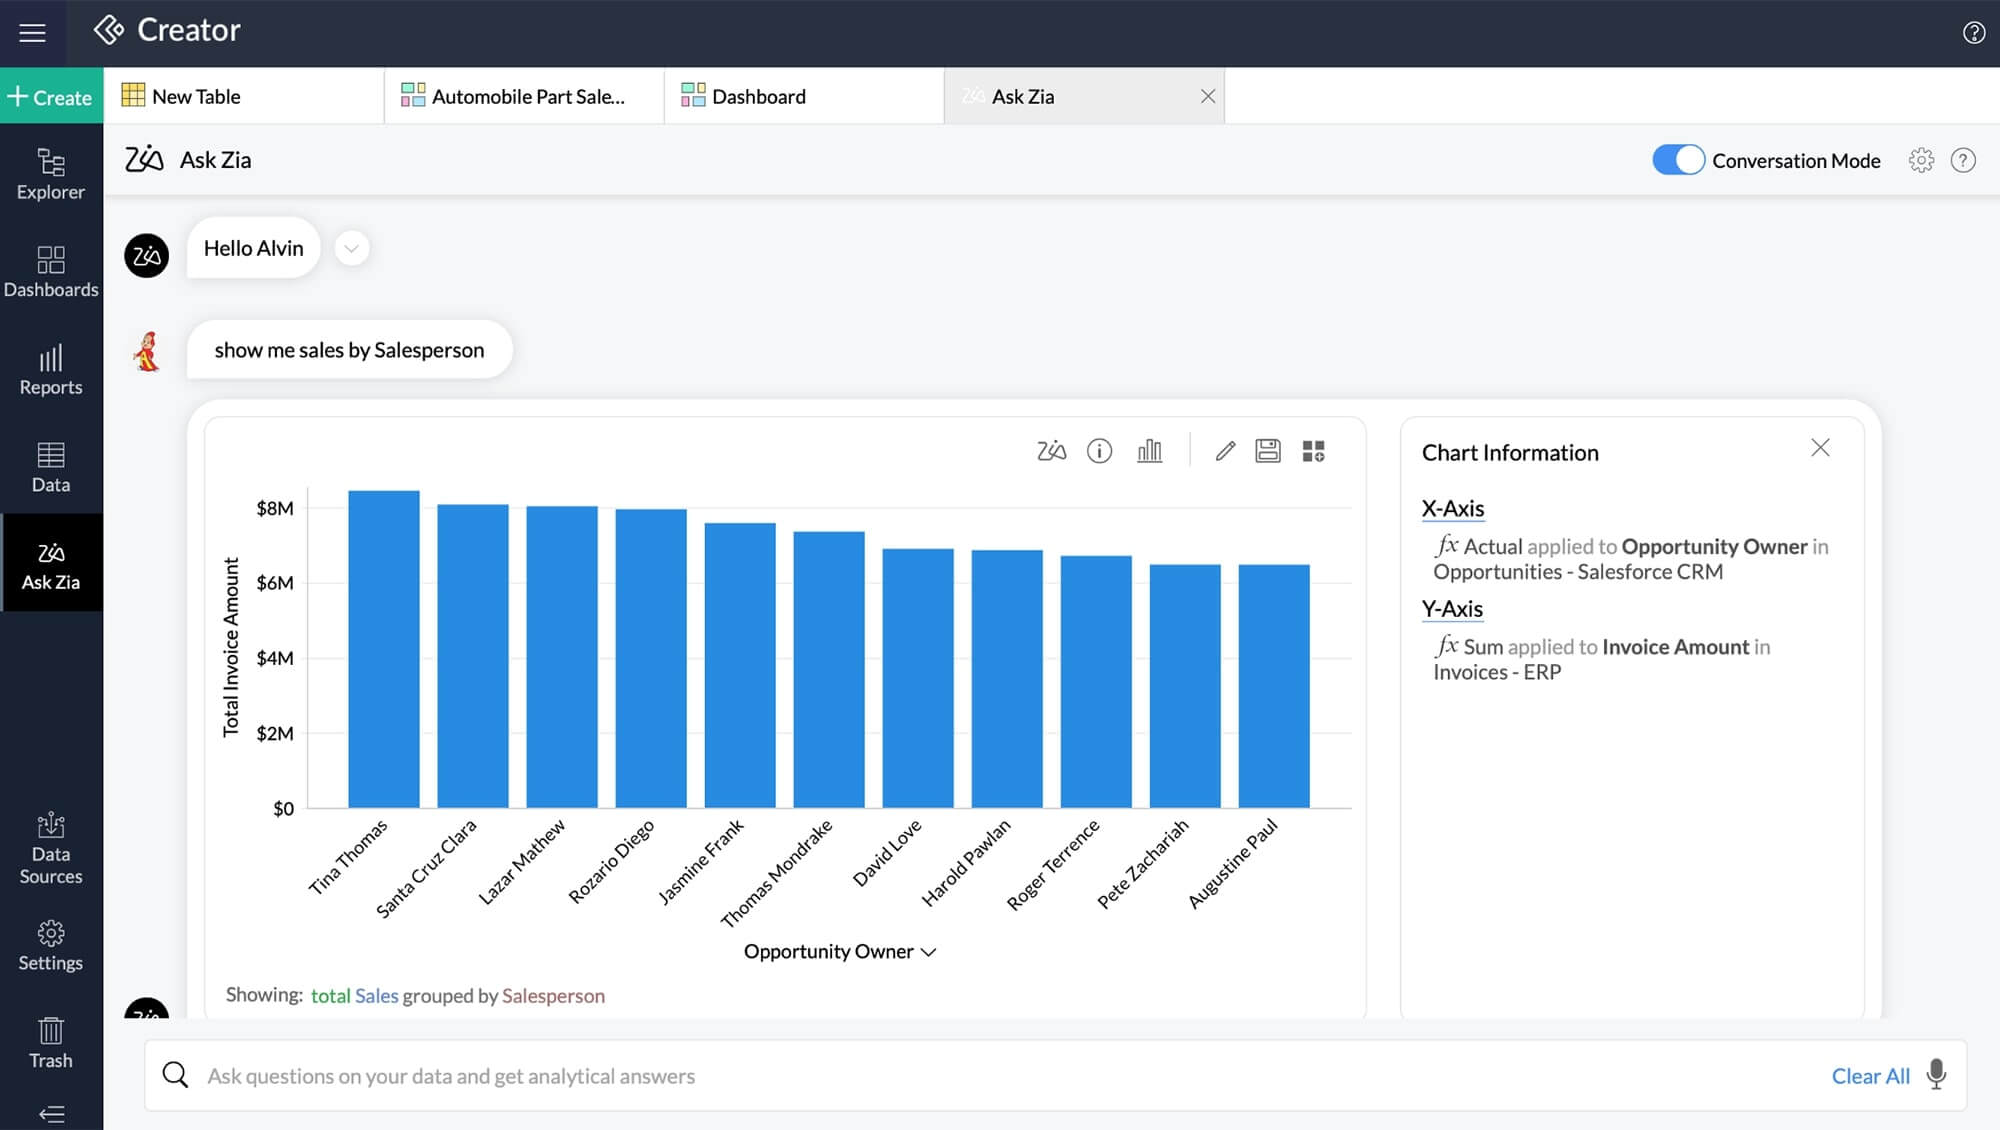
Leverage Zia, Zoho's conversational AI assistant, to get instant answers for all your questions, auto-generate visualizations, and speed up decision-making. As time goes on, Zia learns your data and business needs and helps you build key metrics by suggesting relevant charts or reports.
COLLABORATIVE ANALYTICS
Gain complete control over your data
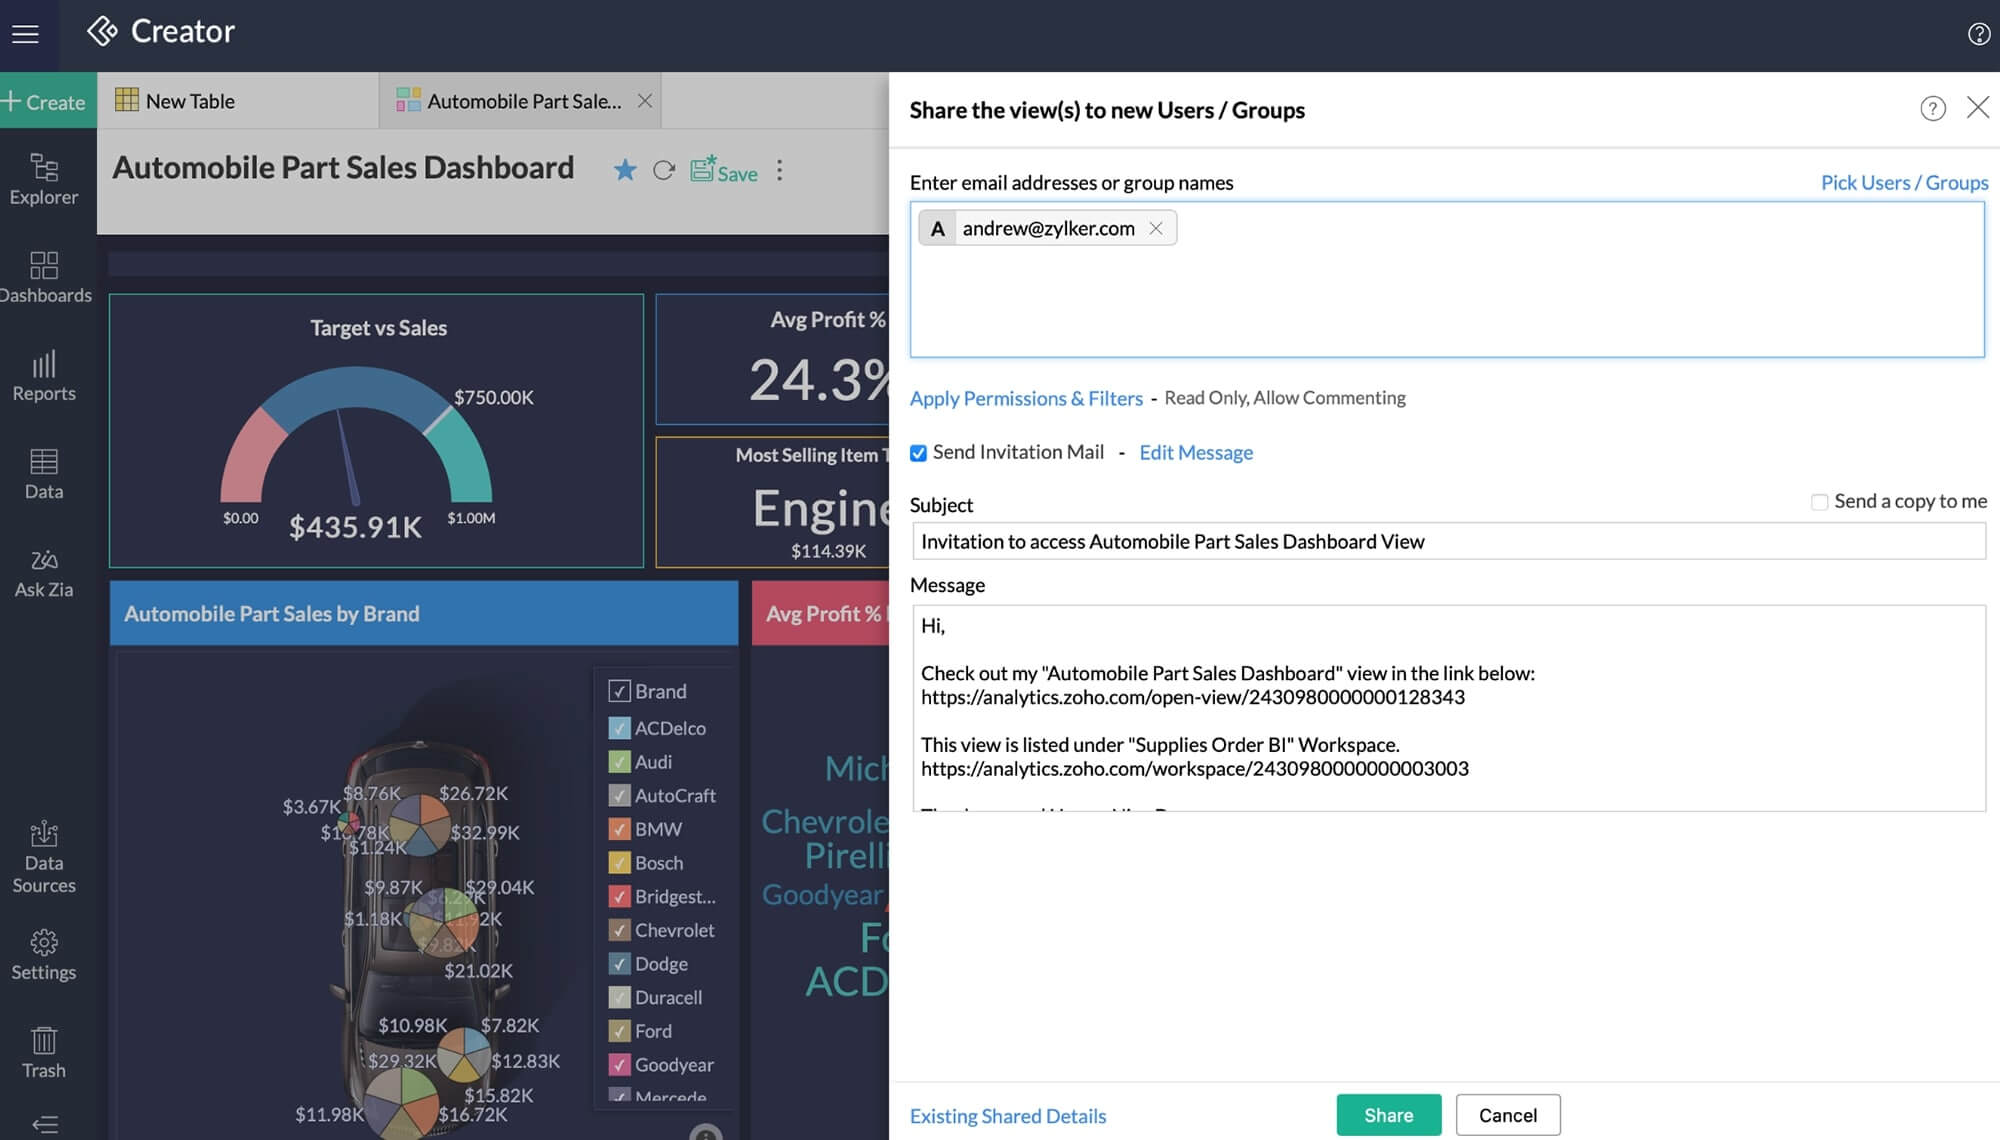
Utilize fine-grained access controls with specific options like read-only, read-write, report authoring, export, and more, and share reports and dashboards with colleagues. Determine which criteria to use based on factors like the role of the person and how they'll use the data. You can even use the commenting feature to start conversations with peers on any reports or dashboards.
SELF-SERVICE PORTALS
Set up reporting portals for customers and vendors
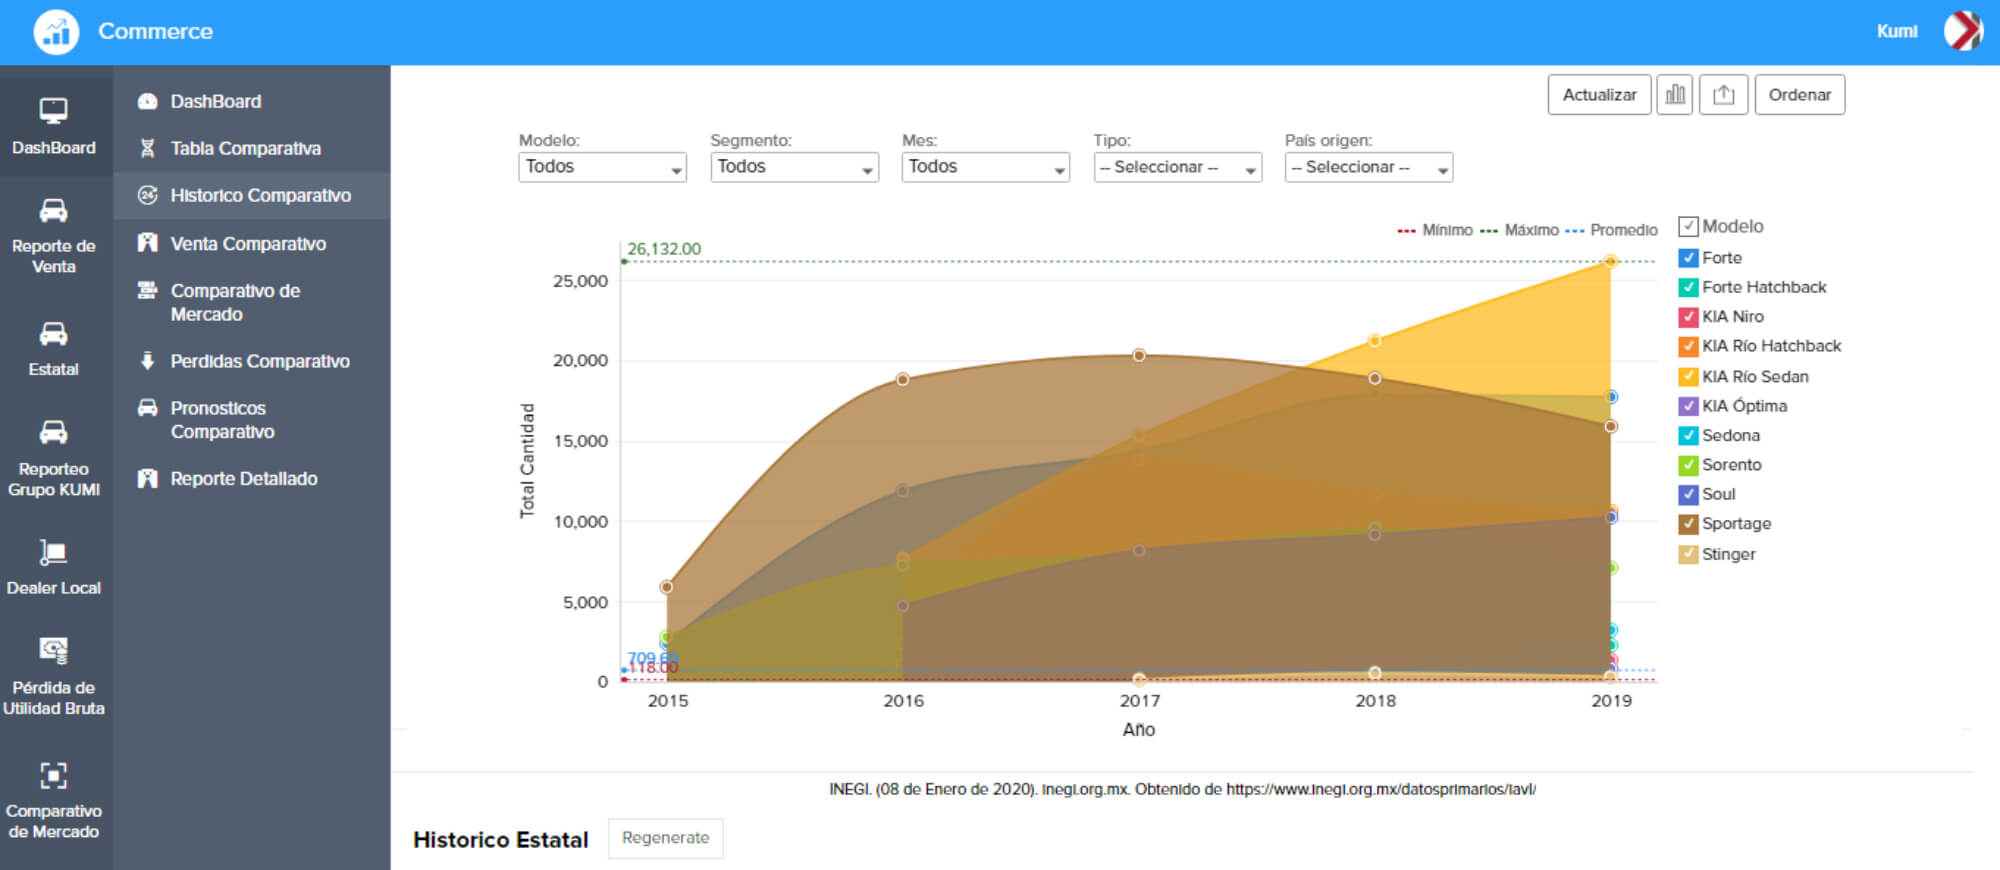
Create your own reporting portal or microsite, embed relevant reports, and provide contextual insights to your vendors, customers, and business consultants. Personalize portals with your company logo and other visual elements to match your brand identity and enhance your user experience with single sign-on authentication (SSO).
MOBILE BI
Gain a 360-degree view of your data—even on the go
Enable your employees to access reports, share information, and take action from their iOS and Android-powered mobile devices. For easy access, they can favorite the reports they use often and access them even when they're offline.

Utilize BI to boost every function of your business
Sales Analytics
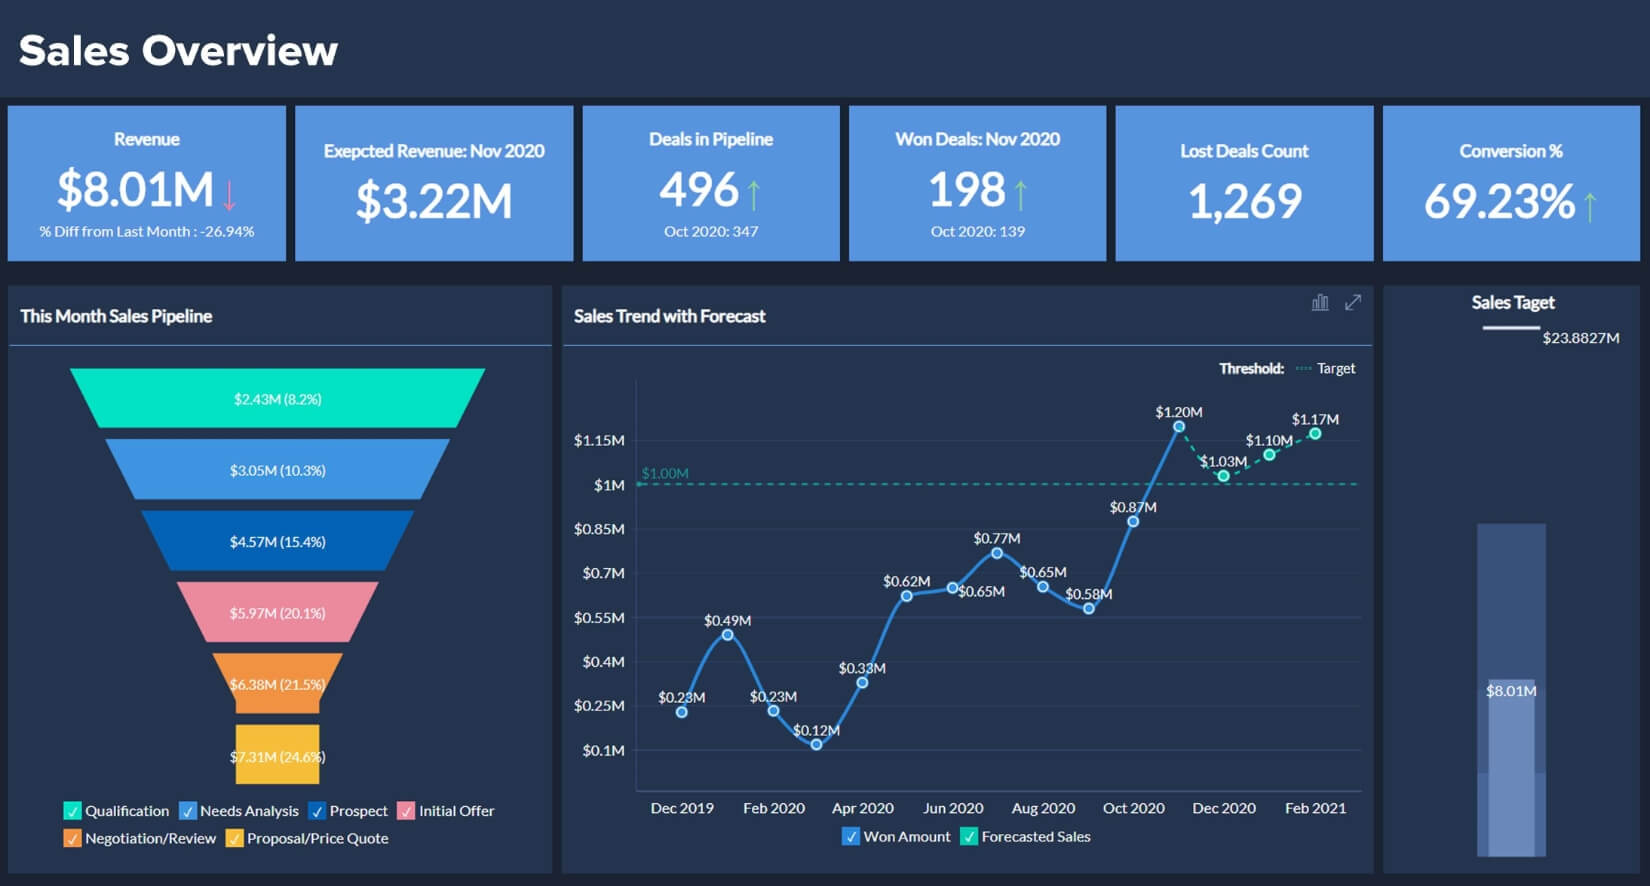
Your sales team can use BI and analytics to better understand the sales pipeline and quickly identify prospects, forecast trends, spot high-performing lead sources, and focus on regions requiring attention.

Marketing Analytics
Enable your marketing team to pull data from the different marketing software they use, such as Mailchimp, Google Analytics, HubSpot, and more, and combine them to analyze key metrics like digital spending, website performance, and conversion rate.

Finance Analytics
Empower your finance team to stay on top of important financial KPIs with easy-to-grasp financial dashboards. Set contextual alerts for deviations or anomalies in your financial data and react to changes as they happen.

Customer Support & Service Analytics
Create bespoke reports on the fly and enable your support team with insights on tickets that require immediate attention and to keep a tab on parameters such as average response time, customer happiness, and resolution time.

Human Resource Analytics
Create self-service analytics and enable your HR teams to gain complete visibility into all aspects of the employee lifecycle— recruitment, performance management, training, engagement, and retention.

Explore relevant features
Empower everyone in your organization to make data-driven decisions.
Try for freeFrequently Asked Questions
Zoho Creator enables you to create different types of reports based on your requirements—List report, Calendar report, Spreadsheet report, Kanban report, Timeline report Map report, Pivot table, Pivot chart. To learn more about them, click here.
Yes, you can export the reports & dashboards that you create into various file formats. Zoho Creator supports exporting into the following formats—Spreadsheet, PDF, HTML, XML, JSON, CSV, TSV. To learn more about them, click here.
Zoho Creator is a low-code application platform (LCAP) that empowers businesses to create custom applications much faster than traditional methods. It offers intuitive builders, ready-to-use code snippets, and templates that make it easy for almost anyone to develop applications. If you're looking to break free from spreadsheets or legacy systems, switch to Zoho Creator and build modern AI-powered applications for your business.
Zoho Creator has a 15-day free trial of all premium features. You can get started by signing up here.


