- HOME
- BI & Analytics
- How to Choose the Right BI Tool (What to Look For Before You Buy)
How to Choose the Right BI Tool (What to Look For Before You Buy)
- Last Updated : March 20, 2026
- 915 Views
- 19 Min Read
Business Intelligence (BI) transforms scattered data into strategic decisions. Organizations today rely on BI to identify opportunities, mitigate risks, and stay ahead of competitors. While definitions vary across industry leaders, the core mission remains consistent: converting raw information into insights that drive smarter actions and measurable outcomes. Gartner defines BI as "an umbrella term that includes the applications, infrastructure, tools, and best practices that enable access to and analysis of information to improve and optimize decisions and performance." Similarly, Forrester describes BI as "a set of methodologies, processes, architectures, and technologies that transform raw data into meaningful and useful information." While BI may have different definitions, they all emphasize its core purpose, turning data into valuable insights for better decision-making.
TL;DR
- What BI is: Business Intelligence converts raw data into actionable insights that improve decision-making, reveal trends, and optimize organizational performance.
- Why choosing the right BI tool matters: The right platform accelerates insights, empowers teams to work independently, scales with your business, and delivers ROI through reduced manual work and faster decisions.
- What criteria this guide covers: Data connectivity, ease of use, AI capabilities, visualization quality, collaboration features, scalability, security, pricing transparency, and real-world tool comparisons.
How to choose the right BI tool for your business
The right BI tool should help your team make faster, smarter choices with data from day one. Here are a few practical tips to help you make the right decision:
Step 1: Start with your business questions
Step 2: Match the tool to your team's comfort level
Step 3: Try it out with your own data
Step 4: See how fast you can go from data to answers
Step 5: Consider integration depth. Not just availability
Step 6: Think beyond dashboards
Step 7: Know what you're really paying for
Step 8: Make sure it helps team work together
Step 1: Start with your business questions
Rather than asking, "What can this tool do?", ask, "What do I need to know to make better decisions?" Identify key questions each department wants answer to - like tracking sales trends, measuring customer satisfaction, or evaluating campaign effectiveness. Choose a right BI tool that helps you uncover these questions quickly and clearly.
If you're a growing SaaS company and need to evaluate churn metrics across its CRM and billing systems, and the marketing team wants to know which customer segments are most at risk, while the product team needs to understand feature adoption patterns. Instead of buying a tool with hundreds of features, they focus on platforms that can answer: "Which customers are likely to churn next quarter?" and "What features correlate with retention?" This clarity narrows their search to tools with strong predictive analytics and multi-source data blending.
Step 2: Match the tool to your team's comfort level
A powerful BI tool is useless if your team can't use it. Think about who will be working with the data - whether it's analysts, non-technical users, or a mix of both. Choose a right BI platform that empowers businesses of all sizes and departments like sales, marketing, or finance looking for rapid setups and broad data connectivity to explore data on their own without relying on IT constantly.
If a mid-sized retail company has a small analytics team but wants regional managers to build their own sales reports and they test three BI tools: one requires SQL knowledge, another has a steep learning curve with complex menus, and the third offers drag-and-drop report building with guided workflows. After a two-week pilot, the regional managers successfully create their first dashboards using the third tool without any IT intervention. This validates that the tool matches their team's actual skill level, not just the vendor's promises.
Step 3: Try it out with your own data
Rather than watching a demo, get your hands on the tool and test it with your actual data and build your first dashboard online. Focus on how easy it is to import data, create dashboards, and collaborate across teams. This is the best way to find out if the tool is truly intuitive or if it only looks good in a sales pitch.
When an e-commerce company uploads three months of transaction data, customer demographics, and marketing spend into a trial account, within the first hour, they discover that one tool struggles with their CSV format, requiring manual reformatting. Another tool imports smoothly but takes 10 minutes to generate a simple sales-by-region chart. The third tool imports the data in seconds and lets them build an interactive dashboard showing revenue trends, top-performing products, and customer lifetime value in under 30 minutes. This real-world test immediately eliminates two contenders.
Step 4: See how fast you can go from data to answers
Time is everything when it comes to decision making. Can your team connect data, build reports, and answer questions without waiting long? The right BI tool should reduce the time between a question and answer.
For example, during a quarterly business review, the CFO asks, "How did our customer acquisition cost change month-over-month in Q4?" With the right BI tool, the marketing analyst pulls up a pre-built dashboard, applies a date filter, and shares the answer on-screen within 30 seconds. With a slower or more complex tool, this same question would require exporting data to Excel, running calculations manually, and scheduling a follow-up meeting, turning a 30-second answer into a 30-minute delay.
Step 5: Consider integration depth. Not just availability
Most of the BI tools say they integrate with popular apps, but what matters is how well they do it. Can the tool bring in data from all your critical systems like CRM, helpdesk, marketing, etc.? Choose a platform that has reliable integrations that work in the background, so you're not stuck uploading spreadsheets.
Step 6: Think beyond dashboards
The goal isn't just to build dashboards - it's to make better decisions. Explore whether the tools support data story telling, alerts, or even predictive analytics. The more proactive the tool is, the more value it brings.
Step 7: Know what you're really paying for
Pricing can be deceptive. Some tools look affordable at first, but the cost adds up fast for users, storage, advanced features, or even basic support can sneak in later. Understand the full pricing model: monthly pricing, setup time, and any hidden costs. A smart choice now saves you headaches (and money) down the road.
Step 8: Make sure it helps teams work together
Sharing dashboards is one thing. But the real value comes when your team can comment on reports, tag each other, and have real conversations around the data - all in one place. Look for a BI tool that makes collaboration easy, so insights don't just sit in charts - they lead to action.
BI tool selection criteria: Features to evaluate before you buy
Selecting a BI tool is a long-term decision that shapes how teams access, analyze, and act on data. While feature lists may look similar across platforms, the true differentiation comes from how effectively those features meet real-world business needs.
Below are the key BI features to evaluate when evaluating a BI tool.
Data connectivity and integration
Your BI platform needs seamless connections to wherever your business data lives. Strong integration capabilities ensure insights are built on complete and current data rather than fragmented or outdated datasets.
An effective platform simplifies data access by bringing together information from multiple sources, maintains consistency, and reduces manual data handling.
What to evaluate:
- Prebuilt data connectors for databases, SaaS applications, spreadsheets, cloud apps, etc.
- Support for scheduled and real-time data refreshes.
- Ability to combine data from multiple sources without complex code.
- APIs or extensibility for custom data integrations.
Data preparation and modeling
Before analysis begins, raw data often needs cleaning and structuring. Platforms with built-in data preparation capabilities help teams transform data without relying on engineering or IT.
When preparation and modeling happen within the BI platform, users spend less time wrangling data and more time generating insights.
What to evaluate:
- Visual data preparation workflows for joins, transformations, and calculations
- Support for reusable data models for consistent reporting
- Ability to manage large, complex datasets
- Automated data cleanup and enrichment options
Ease of use and self-service analytics
Adoption often presents the biggest challenge with BI tools. Platforms designed for self-service analytics empower business users to explore data independently, without requiring constant help from analysts.
Ease of use plays a major role in adoption and long-term success.
What to evaluate:
- Intuitive interface designed for non-technical users
- Drag-and-drop feature for easy report and dashboard creation
- Self-service filtering, drilling, and slicing of data
- Minimal learning curve for everyday user
Advanced analytics and AI capabilities
Modern BI platforms with advanced analytics and AI capabilities help users move beyond basic reporting by uncovering hidden patterns, understanding causes, and predicting future trends.
These features reduce the effort required to find insights and enable teams to shift from reporting what happened to understanding why it happened and what may happen next.
What to evaluate:
- Automated detection of trends and anomalies
- Forecasting and predictive analysis features
- Smart AI-driven insights or recommendation
- Contextual explanation that help users understand easily
Interactive data visualization and dashboards
Visualization should do more than just present data, it should encourage exploration. Interactive data visualizations help users to ask follow-up questions and uncover deeper insights without rebuilding reporting.
Strong data visualization capabilities improve both clarity and engagement.
What to evaluate:
- Drill-down and filtering within charts
- Customizable dashboard layout for different user roles
- Support for a wide range of data visualization types
- Optimized viewing across web and mobile devices
Collaboration and sharing
Insights deliver maximum value when shared and acted upon. BI platforms should make collaboration easy while maintaining control over access.
Effective collaborative features keep teams aligned and ensure insights reach decision-makers at the right time.
What to evaluate:
- Secure sharing of dashboards and reports
- Role-based access and permission controls
- Options for annotations and comments
- Ability to embed analytics into internal applications
Scalability and performance
As data volumes and user adoption grow, BI tools must continue to perform reliably. Scalability ensures that the platform supports future business needs without re-architecture or migration.
Consistent performance is critical for user trust and long-term adoption.
What to evaluate:
- Ability to handle large and growing datasets
- Fast query performance for multiple users
- Support to scale users and workloads
- Cloud and distributed processing capabilities
Security, governance, and compliance
Data security and governance are essential, especially for organizations handling sensitive or regulated data. A BI platform should provide visibility and balance strong controls with ease of access for users.
Governance features build confidence in data accuracy and regulatory compliance.
What to evaluate:
- Role-based access controls and data-level security
- Audit logs and data lineage
- Centralized metric definitions
- Compliance with industry and regional standards
Transparent pricing and low total cost of ownership
Pricing plays a major role in BI tool selection, but it shouldn't be evaluated based on subscription fees alone. A strong BI solution should offer clear pricing structures and help you estimate the long-term cost of ownership as your usage scales.
When you understand how pricing works across users, data volume, add-ons, and support, you can plan budgets more accurately and avoid unexpected costs.
What to evaluate:
- Clear and easy-to-understand pricing plans
- Predictable costs whether priced per user, per capacity, or per usage
- Transparent around premium features, add-ons, and upgrades
- Reasonable implementation, training, and ongoing support expenses
Evaluation summary: Key criteria at a glance
| Criteria | Why it matters | Priority level |
| Data connectivity | Ensures insights are built on complete, current data from all systems | Critical |
| Ease of use | Drives adoption; empowers non-technical teams to self-serve | Critical |
| AI capabilities | Uncovers hidden patterns, predicts trends, accelerates insights | High |
| Visualization quality | Improves clarity, engagement, and ability to explore data | High |
| Collaboration | Turns insights into action through team alignment | Medium |
| Scalability | Prevents migration costs; supports business growth | High |
| Security and governance | Protects sensitive data; ensures compliance and trust | Critical |
| Transparent pricing | Enables accurate budgeting; avoids surprise costs | High |
Popular BI tools in the market (and what they're best at)
There are several BI tools available in the market, each offering different features based on data analytics, integration capabilities, data visualization, AI-powered analytics, and embedded analytics.
- Zoho Analytics – Best for AI-powered self-service BI
- Microsoft Power BI – Best for Microsoft-first enterprises
- Tableau – Best for advanced visual storytelling
A quick comparison of BI tools
| Features | Zoho Analytics | Tableau | Microsoft Power BI |
| Data blending | Automated data blending | Requires manual jins and configurations | Manual setup for complex datasets |
| Data integration | 500+ native data connectors | 120+ data connectors | Powerful Microsoft integration but requires manual setup for others |
| Data preparation | Built-in Zoho Data Prep | Tableau Prep (Sold separately) | Requires Power Query and is more complex |
| Data visualization | Drag-and-drop user interface | Manual customization for advanced visualizations | Separate desktop app for creating reports |
| Generative AI | Zia AI or insights and NLP queries | Tableau AI with limited automation | Power BI AI with limited automation |
| DSML studio | Built-in DSML tools for predictive analysis | Siupports ML but requires Python or R integrations for advanced capabilities | Requires Azure ML, uses Python for advanced ML capabilities |
| Automation and reporting | Automated data workflows and data reporting | Basic automation requires external integrations | Limited without paid licenses |
| Collaboration | Real-time collaboration | Less advanced and lack real-time functionality | Requires Pro or Premium versions for collaboration |
| Deployment flexibility | Flexible cloud and on-premises deployment | Primarily cloud-based with limited on-premises deployment | Mostly cloud, on-premises requires Power BI Server |
| Scalability | Scales easily and supports data growth | Expensive as users scale | Requires Premium for large datasets |
| Global presense and compliance | Strong global presence with global data centers | Global footprint but with higher pricing and limited regional adaptability | Strong compliance but eithin the Microsoft ecosystem |
| Security and governance | ISO/IEC 27001, 27017, 27018, SOC 2 Type 2, GDPR, HIPAA | ISO 27001, SOC Type II, GDPR | ISO 27001, 27018, GDPR, HIPAA |
Zoho Analytics
Zoho Analytics is a agentic AI powered self-service BI and analytics platform that enables users to convert raw data into actionable insights. With easy drag-and-drop report creation, AI-driven recommendations, and fully customizable dashboards, it offers powerful analytics without requiring advanced technical skills. It is suitable for businesses of all sizes looking for rapid setups and broad data connectivity.
Strengths:
Ease of use
Zoho Analytics is designed to make data analysis accessible to users of all technical backgrounds. Its user-friendly drag-and-drop interface, allows business users to create data visualizations effortlessly without writing queries or relying on IT teams.
At the same time, the platform offers both ease of use and powerful capabilities, allowing advanced users to perform deeper analysis using formulas, custom calculations, and SQL queries, so teams an grow their analytics needs without being limited by the tool's capabilities.
"With Zoho Analytics, the ability to visualize things became easy. Most of my managers now use Zoho dashboards and quickly create reports themselves. Its usability features, like easy drag and drop filters and drill down options, are top-notch."
Daniel Franey
Director & Shareholder, Courier Logistics Limited
Data integration and data preparation
Zoho Analytics supports seamless integrations with 500+ native data connectors including cloud apps, databases, spreadsheets, custom and third-party applications. This enables organizations to bring data from multiple systems into one unified business analytics platform.
Once connected, the platform automatically cleans, prepares, and blends data across sources. This minimizes the need for manual ETL tasks and ensures data is ready for analysis, saving time, enhancing accuracy, and consistency across datasets.
AI-powered analytics
Zoho Analytics leverages integrated AI to streamline data exploration and automatically identify key insights instantly. Users can ask questions in plain English and get immediate visual answers, eliminating the need to navigate complex dashboards or filters.
The platform not only enables queries but also highlights trends, outliers, and hidden patterns that might otherwise go unnoticed. With AI-powered analytics, predictive analytics and intelligent insight generation, businesses move from reactive reporting to more proactive, data-driven decision-making. Check out the top AI-powered BI tools
Advanced data visualization
Zoho Analytics provides a wide variety of data visualization options, enabling users to communicate data clearly and effectively. Interactive dashboards lets stakeholders explore metrics, apply filters, and explore data from various angles.
It also supports automated and scheduled reporting, delivering timely insights to the right people at the right time. Dashboards and reports can be customized and branded to match organizational requirements, making them ideal for both internal and external use.
Collaboration, governance, and security
Zoho Analytics includes built-in collaboration features that allow teams to comment on reports, share insights, and align on data-driven decisions directly within the platform. This turns dashboards into a dynamic discussion hub instead of passive reports.
To support secure analytics at scale, the platform provides role-based access, fine-grained permissions, and auditing capabilities, which safeguard sensitive information while allowing widespread access to valuable insights across the organization.
Scalability and deployment flexibility
Zoho Analytics is built to scale with growing data volumes and user bases, making it suitable for startups, mid-sized businesses, and large enterprises equally. Its performance stays stable even as more teams use it.
The platform offers flexible deployment options, including cloud, on-premise, and hybrid models. This allows organizations to align with regulatory, compliance, and infrastructure needs without compromising on analytics capabilities.
Limitations to consider:
- Learning curve for very advanced custom scripting compared to code-first platforms
- Some niche industry-specific connectors may require custom integration
Pricing and overall cost efficiency
Zoho Analytics follows a transparent pricing model that makes advanced business intelligence accessible without requiring large initial investments. Its flexible plans allow organizations to start small and expand their analytics usage as needs evolve.
By reducing hidden expenses associated with data setup, system infrastructure, and adding users, the platform supports consistent and manageable analytics costs, making it a compelling option for teams looking to balance capability with budget control.
Starting plan: Available from $8 per user per month, with scalable plans based on usage and features.
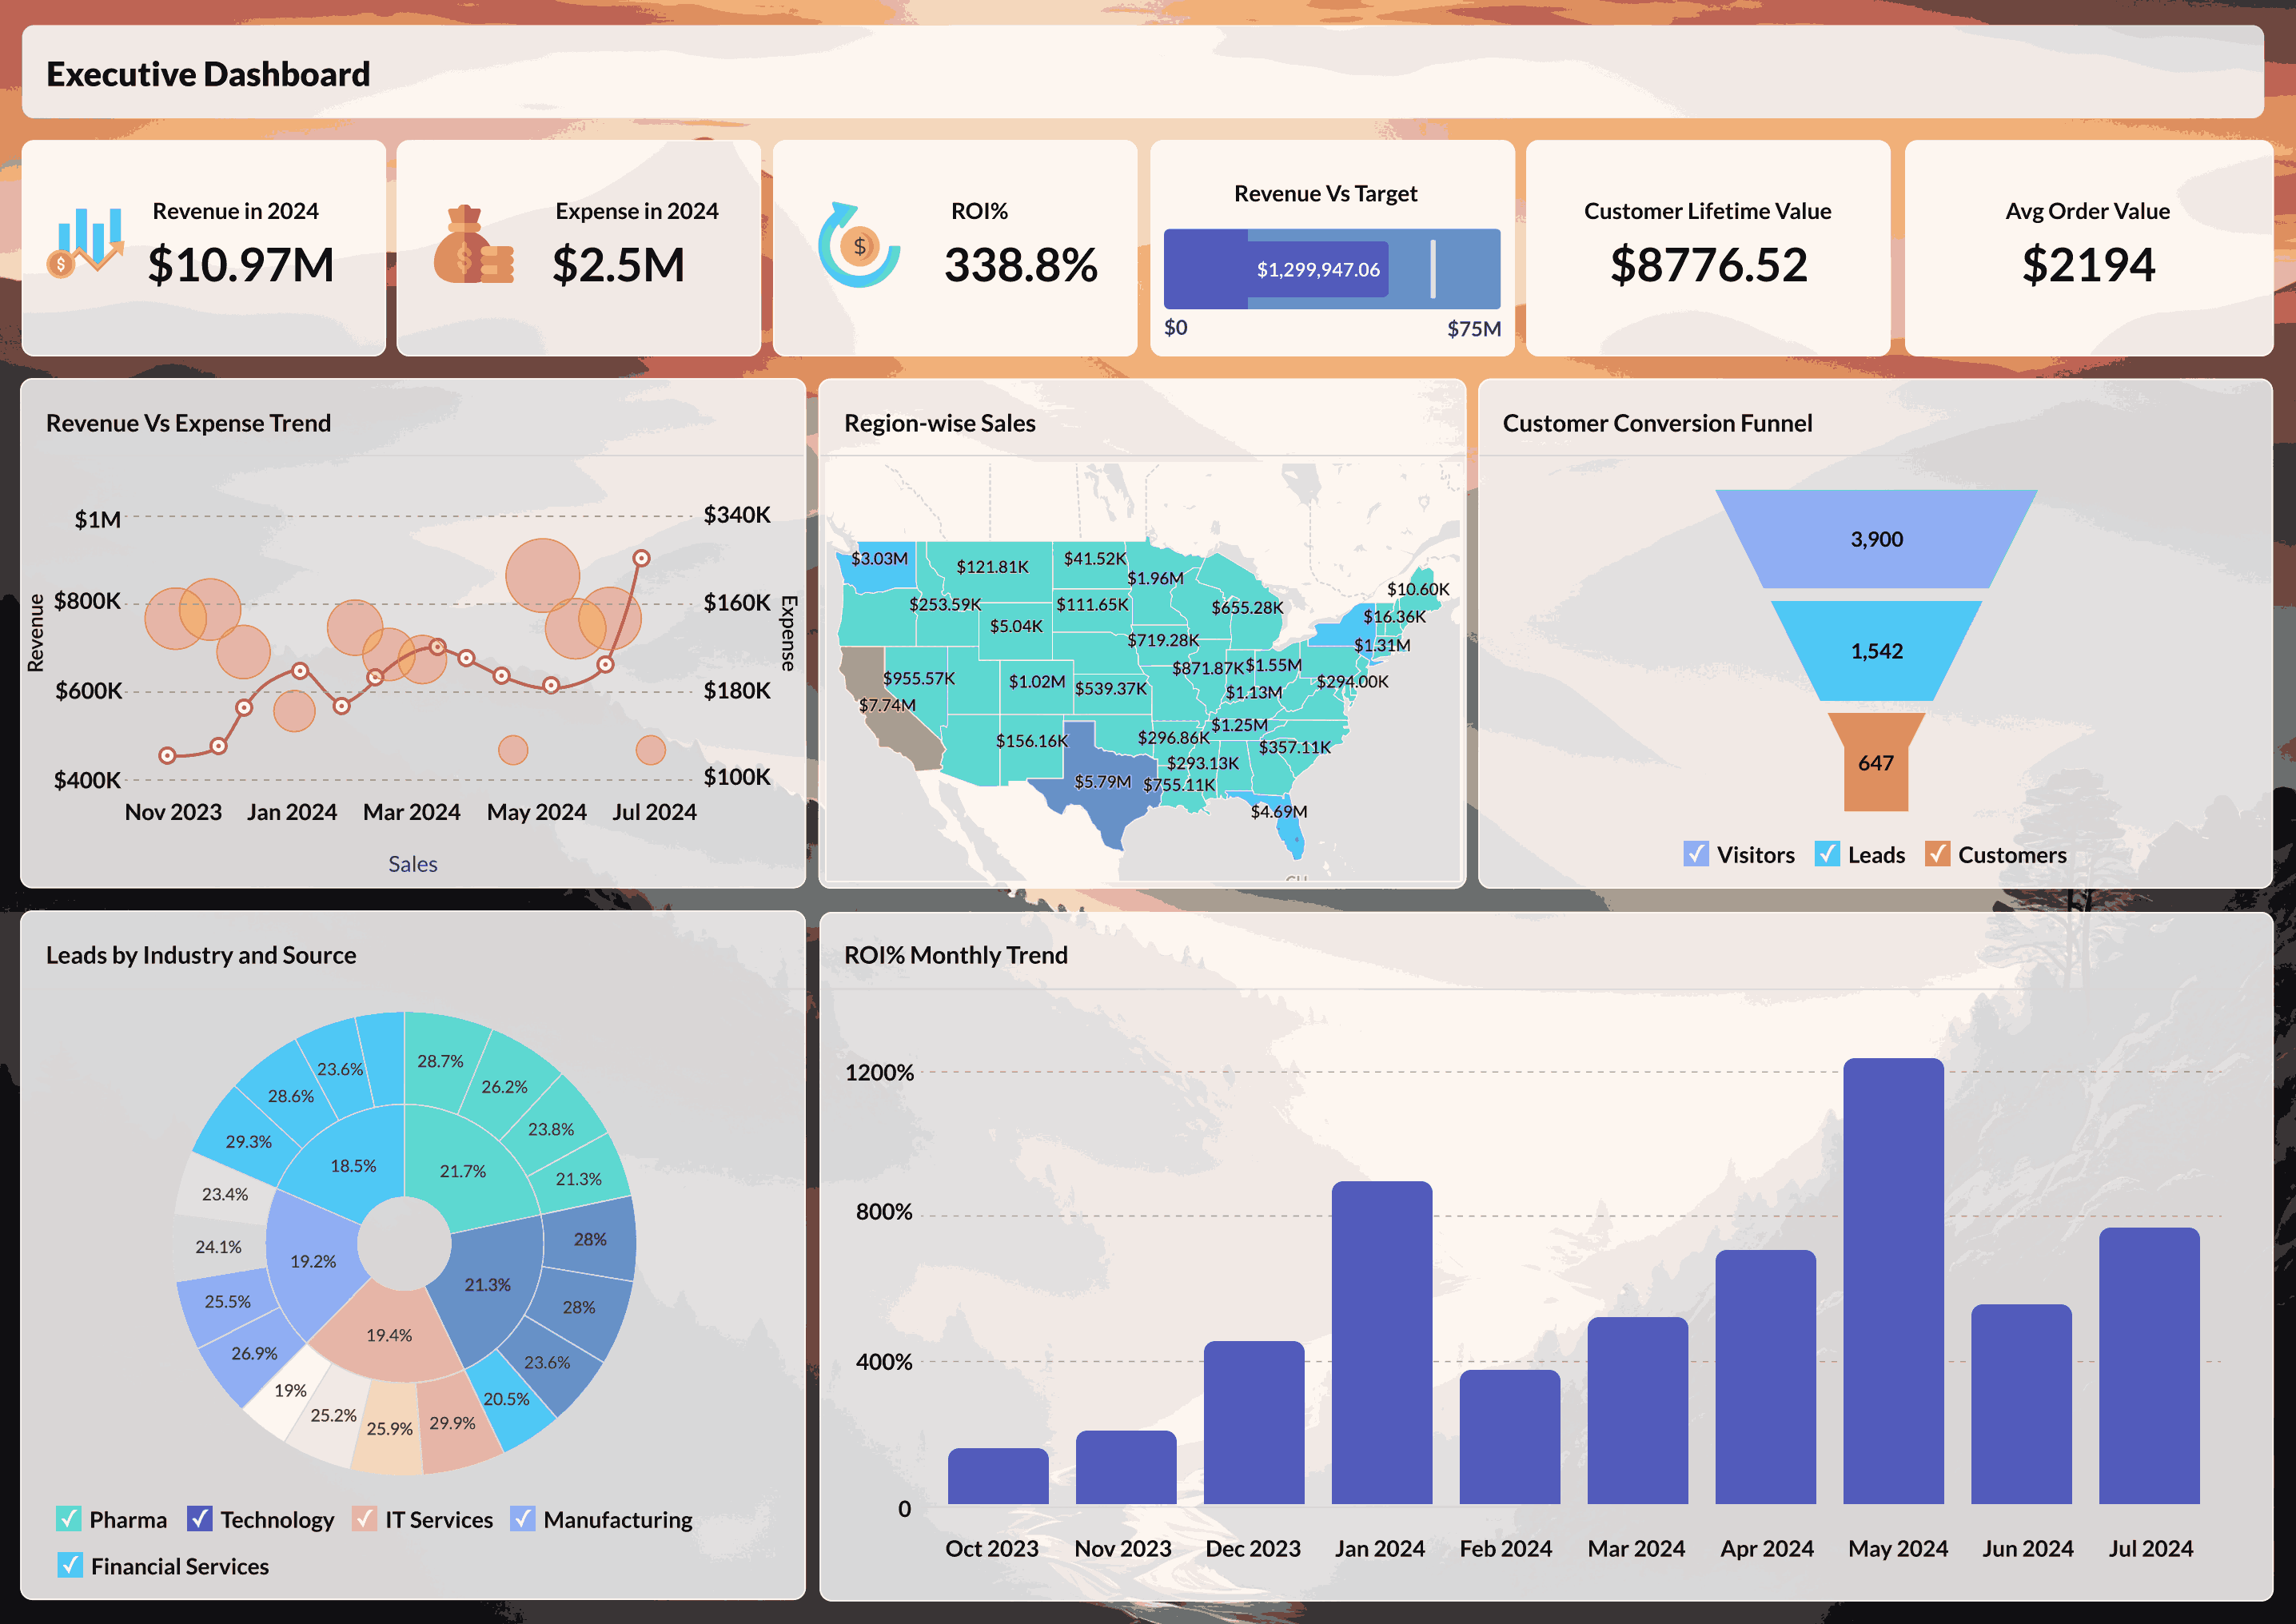
Zoho dashboard:
Tableau
Strengths
Powerful data visualization
Tableau is widely known for its advanced visualization engine, allowing users to create interactive and visually rich dashboards through a drag-and-drop interface. This enhances data exploration and makes it accessible for analysts and visualization experts. However, creating complex dashboards may require time and experience to master the platform fully.
Data connectivity and analysis
Tableau can connect to a wide range of data sources, including databases, cloud applications, and data warehouses. This allows users to analyze diverse datasets in one place. While data connectivity is broad, preparing and blending data often requires additional tools or manual setups, particularly when dealing with huge datasets.
Data storytelling
Tableau dashboards are built to enable data-driven storytelling, letting users to guide audiences through insights using filters, actions, and interactive features. This makes it effective for presentations and reporting. Yet, managing and expanding these dashboards across large teams can require standardized practices.
Scalability and enterprise deployment
Tableau is designed for enterprise-scale deployments and can handle large volumes of data and users. It is frequently used in organizations with mature analytics practices and dedicated BI teams. But, as usage grows, challenges related to licensing, setup, and management may increase, making it a good fit for analytics-led teams rather than general business users.
Limitations to consider
- Steeper learning curve for non-technical users compared to simpler BI tools
- Data preparation often requires external ETL tools or technical expertise
- Costs can escalate quickly with role-based licensing and user growth
- Performance may degrade with extremely large or complex datasets without optimization
Who Should Choose This Tool
Tableau is ideal for organizations with dedicated analytics teams, mature BI practices, and a strong focus on visual storytelling. It works best when you have technical resources to handle data preparation and dashboard management at scale.
Pricing and overall cost
Tableau uses a role-based pricing structure, offering distinct licenses for creators, explorers, and viewers. This approach allows organizations to assign access based on how users interact with data and dashboards. As teams grow, expenses can rise based on the distribution of roles and deployment needs. Also, larger enterprises must factor in costs related to administration, and continuous maintenance as usage expands.
Tableau dashboard:

Microsoft Power BI
Strengths
Interface and ease of adoption
Power BI is designed for users already working within the Microsoft ecosystem, making it easy for teams to get started with minimal onboarding. Its interface closely mirrors Excel, enabling organizations to build on their current reporting workflows into interactive visualizations. Although simple reporting is easy to implement, advanced features like data modeling and customizations typically demands technical skills, making Power BI ideal for teams that has access to IT or analytics professionals.
Strong integration with Microsoft system
Power BI works smoothly with Microsoft services like Excel Azure, SQL Server, and Teams, allowing organizations to analyze data already present in these platforms without complex setup. However, integrating non-Microsoft sources may require additional configuration on licensing.
Advanced data modeling and analytics
Power BI provides robust data modeling capabilities, allowing users to build complex relationships and perform advanced calculations. With tools like DAX, skilled users gain greater control over their analysis. While these capabilities support detailed analysis, it can increase the learning curve, and as analytical demands grow, organizations typically depend more on technical resources to manage models effectively.
Dashboards and visualizations
Power BI offers a variety of interactive data visualizations that allow users to explore data dynamically, Dashboards supports features like drill-downs, filtering, and live updates to assist stakeholders in tracking performance. While customization is flexible, creating highly customized or complicated visuals might demand extra work or the use of third-party tools.
Limitations to consider
- Advanced features require DAX knowledge, which has a steep learning curve
- Non-Microsoft data source integrations can be limited or require workarounds
- Premium features and increased capacity come with significant cost increases
- Data refresh limitations in lower-tier plans can impact real-time analytics
Who Should Choose This Tool
Power BI is best suited for Microsoft-centric organizations with existing investments in Azure, SQL Server, and Office 365. It works particularly well when teams have technical support for data modeling and are comfortable with the Microsoft ecosystem.
Pricing and cost structure
Power BI has a pricing structure tailored to support individual users, small teams, and large enterprises. A free version is available for personal analysis, while paid plans enable report sharing, collaboration, and access to advanced features. As usage scales, costs depend on the number of users, data capacity, and performance needs, which can increase overall investment as analytics adoption increases.
Power BI dashboard:

Are you using the right BI tool?
To make the most of your data, finding the right BI tool is crucial. With so many options out there, how can you be sure you're using the right one?
Signs you might be using the wrong BI tool
- Limited data integration: If your BI tool struggles to connect with data sources, applications, databases, or third-party tools, you're likely to miss out on valuable insights.
- Complex setup and maintenance: If you're constantly relying on IT or data analysts to generate reports, your BI tool may not be the most user-friendly choice.
- Lack of AI and automation: If your BI doesn't provide real-time insights, predictive analytics, or trend forecasting, you might be making decisions based on incomplete data.
- Slow performance and scalability issues: If your reports take a lot of time to load or if your platform struggles with large datasets, it's holding your business back,
- High costs without the features you need: If you're paying extra for basic features like data preparation, collaboration, or AI, your BI tool is overpriced and inefficient.
When Zoho Analytics is the right BI tool for your business
Zoho Analytics is the right choice when you need:
- A self-service BI platform that empowers business users without heavy IT dependence
- AI-powered insights and predictive analytics to move from reactive to proactive decision-making
- Seamless integration with 500+ data sources across cloud apps, databases, and spreadsheets
- Transparent, scalable pricing that grows with your business without surprise costs
- Flexible deployment options (cloud, on-premise, or hybrid) to meet compliance and infrastructure requirements
- Collaborative analytics features that turn dashboards into action hubs
Don't let inefficient BI tools hold your business back. With simplified data analysis and boosted productivity, Zoho Analytics helps businesses of all sizes transform raw data into meaningful insights without breaking the bank.
If you're experiencing any of the pain points mentioned above, or if you're looking for a modern, AI-driven BI solution that scales with your needs, Zoho Analytics deserves serious evaluation.
"Zoho Analytics is the only product with the right mix of cost and value—with features like data visualization, integration, data blending, collaboration, user filters, drag and drop, geomaps, and much more at an affordable price"
Ben Smith
Advisor and former COO of Sugarfina
Sign up for a 15-day free trial or get a personalized demo today and see how Zoho Analytics stacks up against other BI tools. Choose right. Choose Zoho Analytics
FAQs
Which BI tool is easiest to implement?
The easiest BI tool to implement depends on your existing tech stack and team's technical expertise. For organizations already using Microsoft products, Power BI offers quick integration with minimal setup. However, for businesses seeking a truly self-service platform with rapid deployment across diverse data sources, Zoho Analytics stands out with its 500+ native connectors, intuitive drag-and-drop interface, and guided onboarding. Most teams can connect their first data source and build dashboards within hours, not weeks.
What is the difference between BI and data analytics?
Business Intelligence (BI) and data analytics are closely related but serve different purposes. BI focuses on transforming historical and current data into actionable insights through dashboards, reports, and visualizations to support day-to-day decision-making. It answers questions like "What happened?" and "What is happening now?"
Data analytics, on the other hand, goes deeper into exploring data to uncover patterns, predict future trends, and answer "Why did it happen?" and "What will happen next?" While BI tools provide the framework for reporting and monitoring, data analytics often involves statistical analysis, machine learning, and predictive modeling. Many modern BI platforms, like Zoho Analytics, now incorporate advanced analytics and AI capabilities, blurring the line between the two
Is Power BI better than Tableau for small businesses?
For small businesses, Power BI often appears more attractive initially due to its lower entry price point and familiarity for teams already using Microsoft Office. However, "better" depends on your specific needs:
Choose Power BI if you're deeply embedded in the Microsoft ecosystem and have technical resources to handle DAX and data modeling.
Choose Tableau if you need advanced visual storytelling capabilities and have a dedicated analytics team.
Consider Zoho Analytics if you want ease of use, transparent pricing, AI-powered insights, and a platform that grows with your business without requiring constant IT support.
Small businesses benefit most from tools that deliver quick ROI with minimal setup, making ease of adoption and total cost of ownership critical factors beyond just feature lists.
How much does a BI tool typically cost?
BI tool costs vary widely based on pricing models, features, and scale:
Entry-level options: $8-30/user/month (Zoho Analytics, Power BI Pro)
Mid-tier platforms: $50-75/user/month (Tableau Creator, advanced BI features)
Enterprise solutions: $100+/user/month or capacity-based pricing (thousands per month)
However, the listed price rarely tells the full story. Factor in:
- Implementation and setup costs
- Training and ongoing support fees
- Additional charges for extra storage, data refreshes, or premium features
- User growth costs (some tools charge per viewer, not just creators)
Zoho Analytics stands out with transparent pricing and inclusive features—starting at $30/month for 2 users with robust capabilities already built in, eliminating many hidden costs common with other platforms.
What are some tips to choose BI tool for my business?
Start by identifying the business decisions you want to improve, not just the reports you need. Evaluate tools with both technical and business users, and focus on usability, scalability, integrations, and long-term costs rather than just feature depth.
What are the questions to ask before buying a BI tool?
Key questions include whether the tool integrates with your existing data sources, supports self-service analytics, scales with increasing data and users, offers security and governance, and provides transparent pricing as your needs grow.
What are BI tools used for?
BI tools are used to collect, analyze, and visualize data so organizations can track key metrics, automate reporting, uncover trends, and support informed decision-making across different department.
Who can use BI tools?
BI tools are designed for a wide range of users, including data analysts, business managers, executives, and operational teams. Modern BI platforms enable both technical and non-technical users to access insights without relying heavily on IT.
How can BI tools help users?
BI tools reduce reliance on manual data processing, provides timely access to insights, reveal performance patterns, and enable faster responses to business changes. They transform raw data into actionable insights that support better planning and decision-making.
Why are BI tools important?
BI tools are important because they enable organizations to make decisions based on reliable data rather than assumptions. They improve efficiency, increase transparency, support strategic planning, and give businesses a competitive advantage by turning data into a reliable decision-making asset.
 Vinisha
Vinisha is a Marketing Analyst at Zoho Analytics with a strong passion for both marketing and data. She’s naturally curious about trends and loves diving into data to uncover what drives effective campaigns. She has a knack for simplifying complex information and presents insights in a relatable and engaging way that connects with audiences. Outside of work, she enjoys exploring the creative side of digital marketing.