Analytics - Overview
Analytics gives you a clear picture of your organisation’s business expenditures. You can run customised analytic reports to get insights of your business performance and your employees’ spending. For example, if you would like to know the expenses incurred by your organisation in the month of June, you can run an Expense Details report. All the expenses that were incurred in the month of June along with the amount spent and the users who have incurred the expenses will be generated as a detailed report for you.
Also, you can customise the analytic reports to analyze your expenses better, according to your business needs. You can add additional filters based on which details will be generated and you can add the columns that you want to include in your analytic reports.
Notes:
Users in custom roles can perform actions and access modules only based on the permissions enabled for them.
You can access the Purchase Request module only if your admin has enabled it for your organisation.
Generate Analytic Report
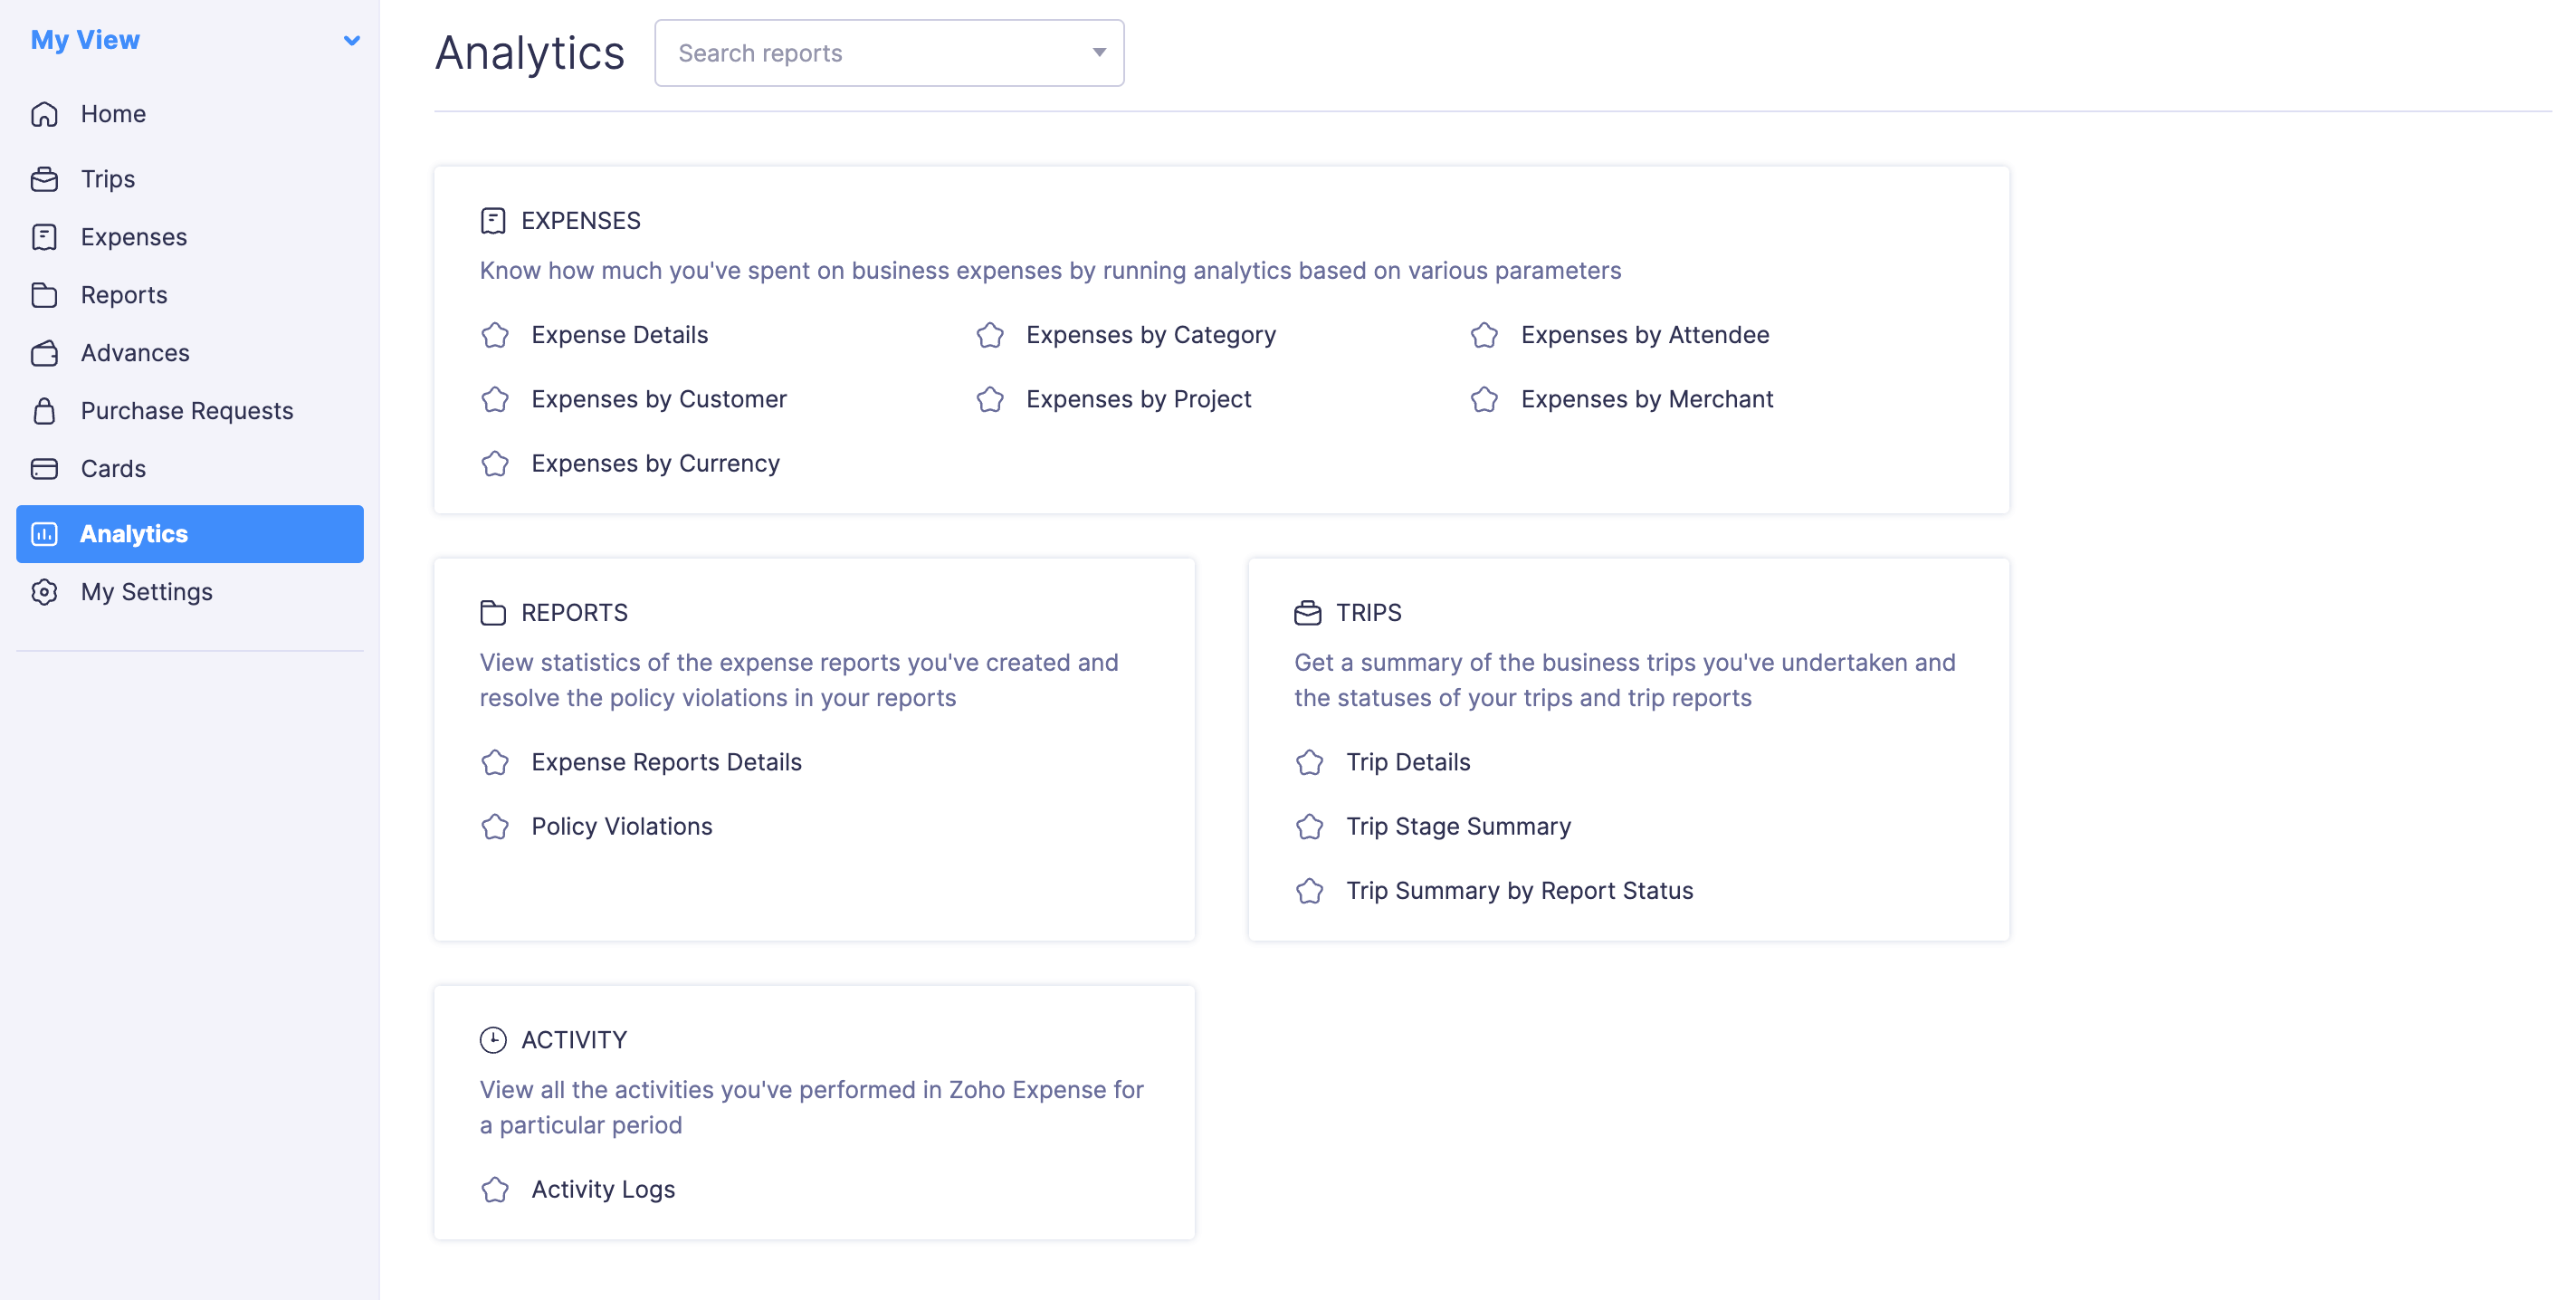
You can generate any of the analytic reports listed in the Analytics page.
Prerequisite: Unsubmitted reports will not be considered for running the analytics.
To generate an analytic report:
- Go to Analytics on the left sidebar.
- Click the analytic report you want to view.

- If you want to generate the analytic report for another time period with additional filters, you can customise it.
- The selected analytic report will be generated with the applied customisation.
Customize Analytic Report
Zoho Expense lets you customise the default analytic reports by applying filters, such as selecting a date range for which you want to view the report, setting criteria, choosing to display only certain columns, etc, helping you to focus only on the data relevant to the task that you’re working on or the information that you need. You can customise the reports based on date, group, and specific criteria.
Scenario:
You need to view the travel expenses for a particular quarter. Using Zoho Expense, you can customise the analytic report by filtering the date range from July 1st to September 30th, focusing on travel-related categories.
Customize By Date
You can customise your search by selecting the time for which you want to generate the report, whether it’s for the current or previous period. You can also set a custom date range based on your need. To do this:
- Navigate to My View.
- Go to Analytics on the left sidebar.
- Click the analytic report you want to customise by date.
- In the Filters section, you can select the time for which you want to generate the report, whether today, this week, this quarter, this year, yesterday, previous week, previous month, previous quarter, previous year, or select a custom date range.
Module Name Date Range Filters Expenses Expense Date Reports Start Date, End Date, Submitted On, Approved Date Trips Start Date, End Date, Created Date, Submitted Date, Approved Date Purchase Request Date Range Activity Date Range

Customize By Groups
You can also select a parameter such as expense, unique code, predefined values, users, etc by which you want to group a report so that the data is categorised based on the selected parameter.
For example, you can group a expense details report by user name to see expense reports categorised by individual employees.
To do this:
- Navigate to My View.
- Go to Analytics on the left sidebar.
- Click the analytic report you want to group.
- Click the Group by dropdown on the right hand side of the page next to Customise Columns.
- From the dropdown, select the parameter by which you want to group the report.

Customize By Criteria
In this section, you can select the field for which you want to apply the criteria, choose a comparator, and enter a value. Once all the specified conditions are met, the relevant report data will be displayed.
To do this:
- Navigate to My View.
- Go to Analytics on the left sidebar.
- Click the analytic report for which you want to apply criteria.
- Click + More Filters in the Filters section.

- First, select the field for which you want to apply the criteria. Second, choose a comparator, and finally, enter a value.
- Click + Add Criteria to add new criteria.
- If you want to change the criteria pattern, click Edit next to the Criteria Pattern.
- Click Run Report.
Note: You can add up to 10 criteria.
Customize Columns
You can customise the columns of your report. To do this:
- Navigate to My View.
- Go to Analytics on the left sidebar.
- Click the analytic report for which you want to customise the columns.
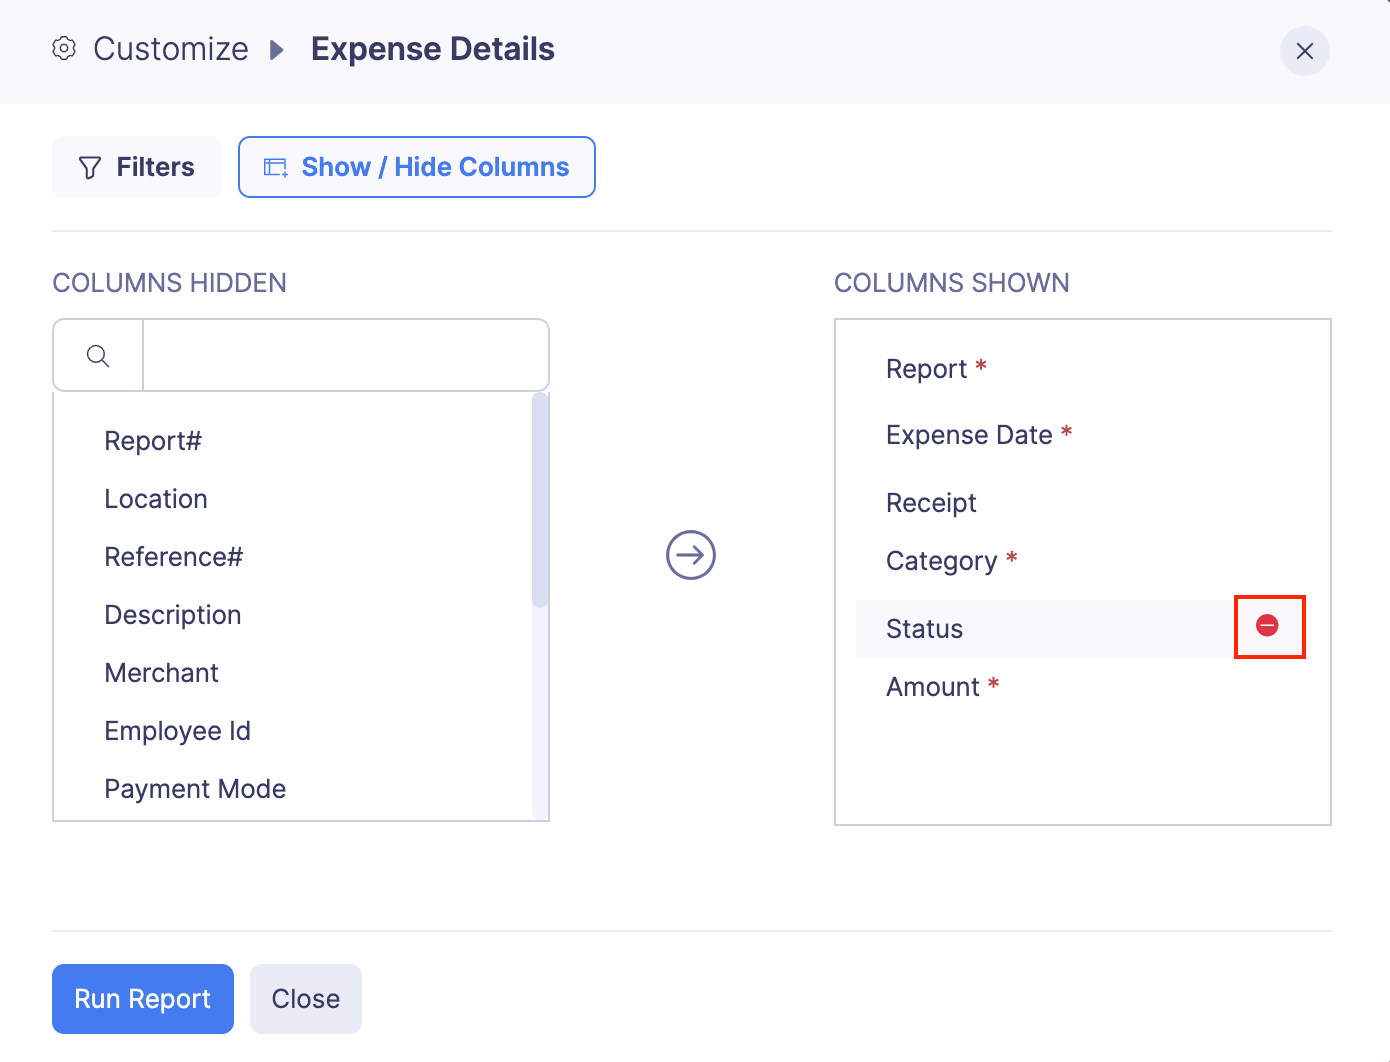
- Click Customise Columns in the right corner next to Group by.
- Go to the Columns Hidden section, hover your cursor over the column you want to add, and click the + icon next to it. It will be moved to the Columns Shown section. In the Columns Shown section, you can view the existing columns of your report.

- In case you do not want to display certain columns, go to the Columns Shown section, hover your cursor over the column you want to remove, and click the - icon next to it. It will be moved to Columns Hidden.

- Once you customise the columns, click Run Report to view the customisations in the report.
Schedule Analytic Report
You can schedule the analytic reports to be generated automatically and sent to multiple users at a time. You can set the frequency at which the reports must be generated and select the users to whom the reports should be sent as an email.
To schedule an analytic report:
- Navigate to My View
- Go to Analytics on the left sidebar.
- Click the analytic report you want to schedule.
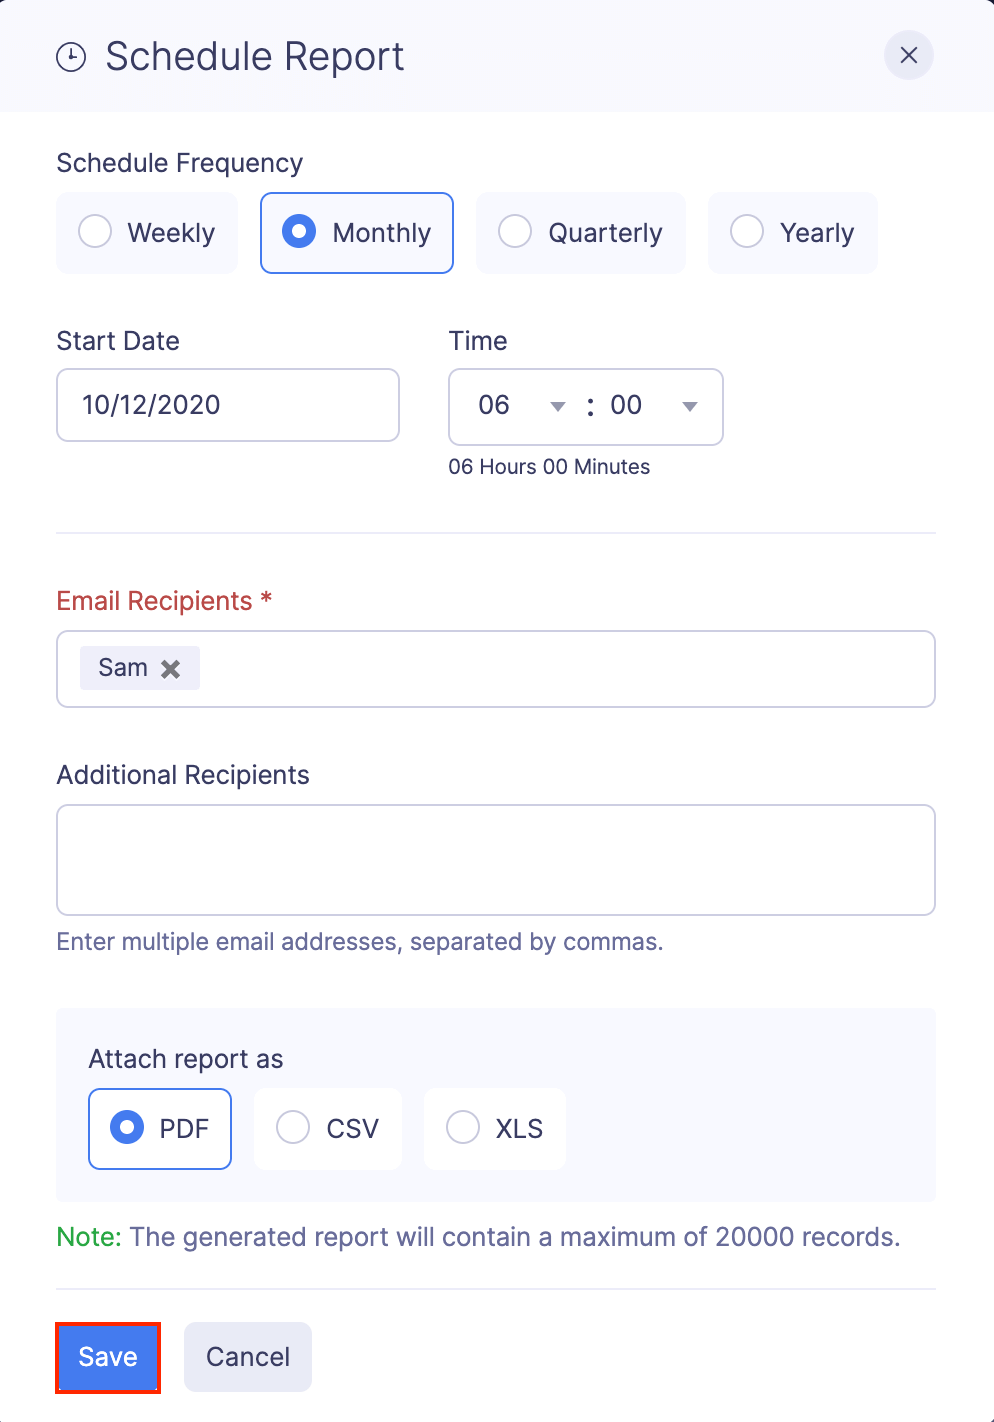
- Click the Schedule icon at the top right next to Export.

- Choose how frequently you want to generate and send the analytic reports.
- Provide a date and time at which you want to generate your first analytic report.
- Select the users to whom you want to send the scheduled analytic reports in the Email Recipients dropdown.
- In case you want to send these scheduled reports to people who are not a part of your Zoho Expense organisation, enter their email addresses separated by commas in the Additional Recipients section.
- Choose the format, such as CSV, XLS, or PDF, in which you want your report to be attached to the email.
- Click Save to schedule the analytic report. The report will be sent to the selected users at the scheduled time.

Export Analytic Report
In Zoho Expense, you can export your analytic report in any of the following formats:
| CSV | XLS or XLSX |
To export an analytic report:
- Go to Analytics on the left sidebar.
- Click the analytic report you want to export. Customise it if required.
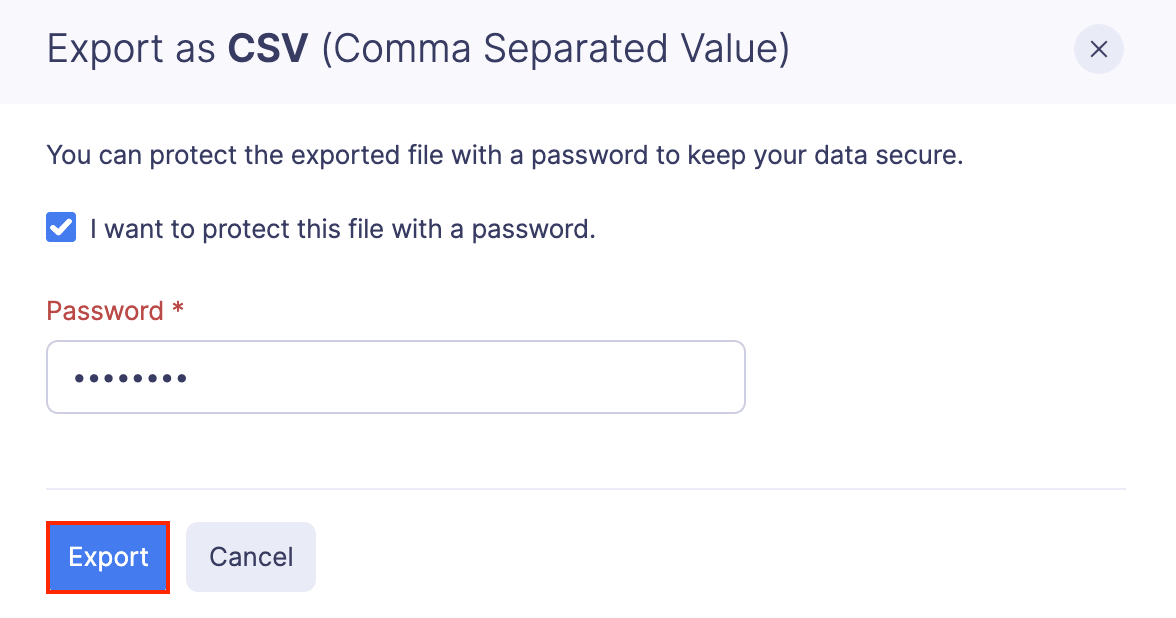
- Click the Export As dropdown at the top right corner of the page. Select the format, such as PDF, XLS, XLSX, or CSV, in which you want to export your analytic report in which you want to export your analytic report. You can also export your analytic report to Zoho Sheet and make use of the customisations available in Zoho Sheet.

- If you want to protect this file with a password, mark I want to protect this file with a password option and enter a password with at least 6 characters.
- If you want to export the report as displayed in the existing order, mark Export my current view. You can export the current view only while exporting data in XLS, CSV, XLSX, and to Zoho Sheets.
- Click Export to export the analytic report.

Print Analytic Report
To print an analytic report:
- Go to Analytics on the left sidebar.
- Click the analytic report you want to print. Customise it, if required.
- Click the Export as dropdown at the top right corner of the page.
- Select Print.

- Click the icon on the top right side of the page and configure your preferences.
- Click Print to print the analytic report.
The following are the various categories for which you can generate analytic reports:
List of Analytic Reports
Expense
- Expense Details
- Expenses by Category
- Expenses by Attendee
- Expenses by Customer
- Expenses by Project
- Expenses by Merchant
- Expenses by Currency


 Yes
Yes