Want to know what the leaders in your domain do when it comes to creating viral tweets on X?
Analyze the best performing X handles, or that of your competitors. Know what makes them tick. Get insights about the kind of content which works the best in X. Compare stats of up to five X handles of your choice. All in a couple of minutes, and just a few clicks.
Sign up in less than 60 seconds
Make the best use of the ready-made dashboards
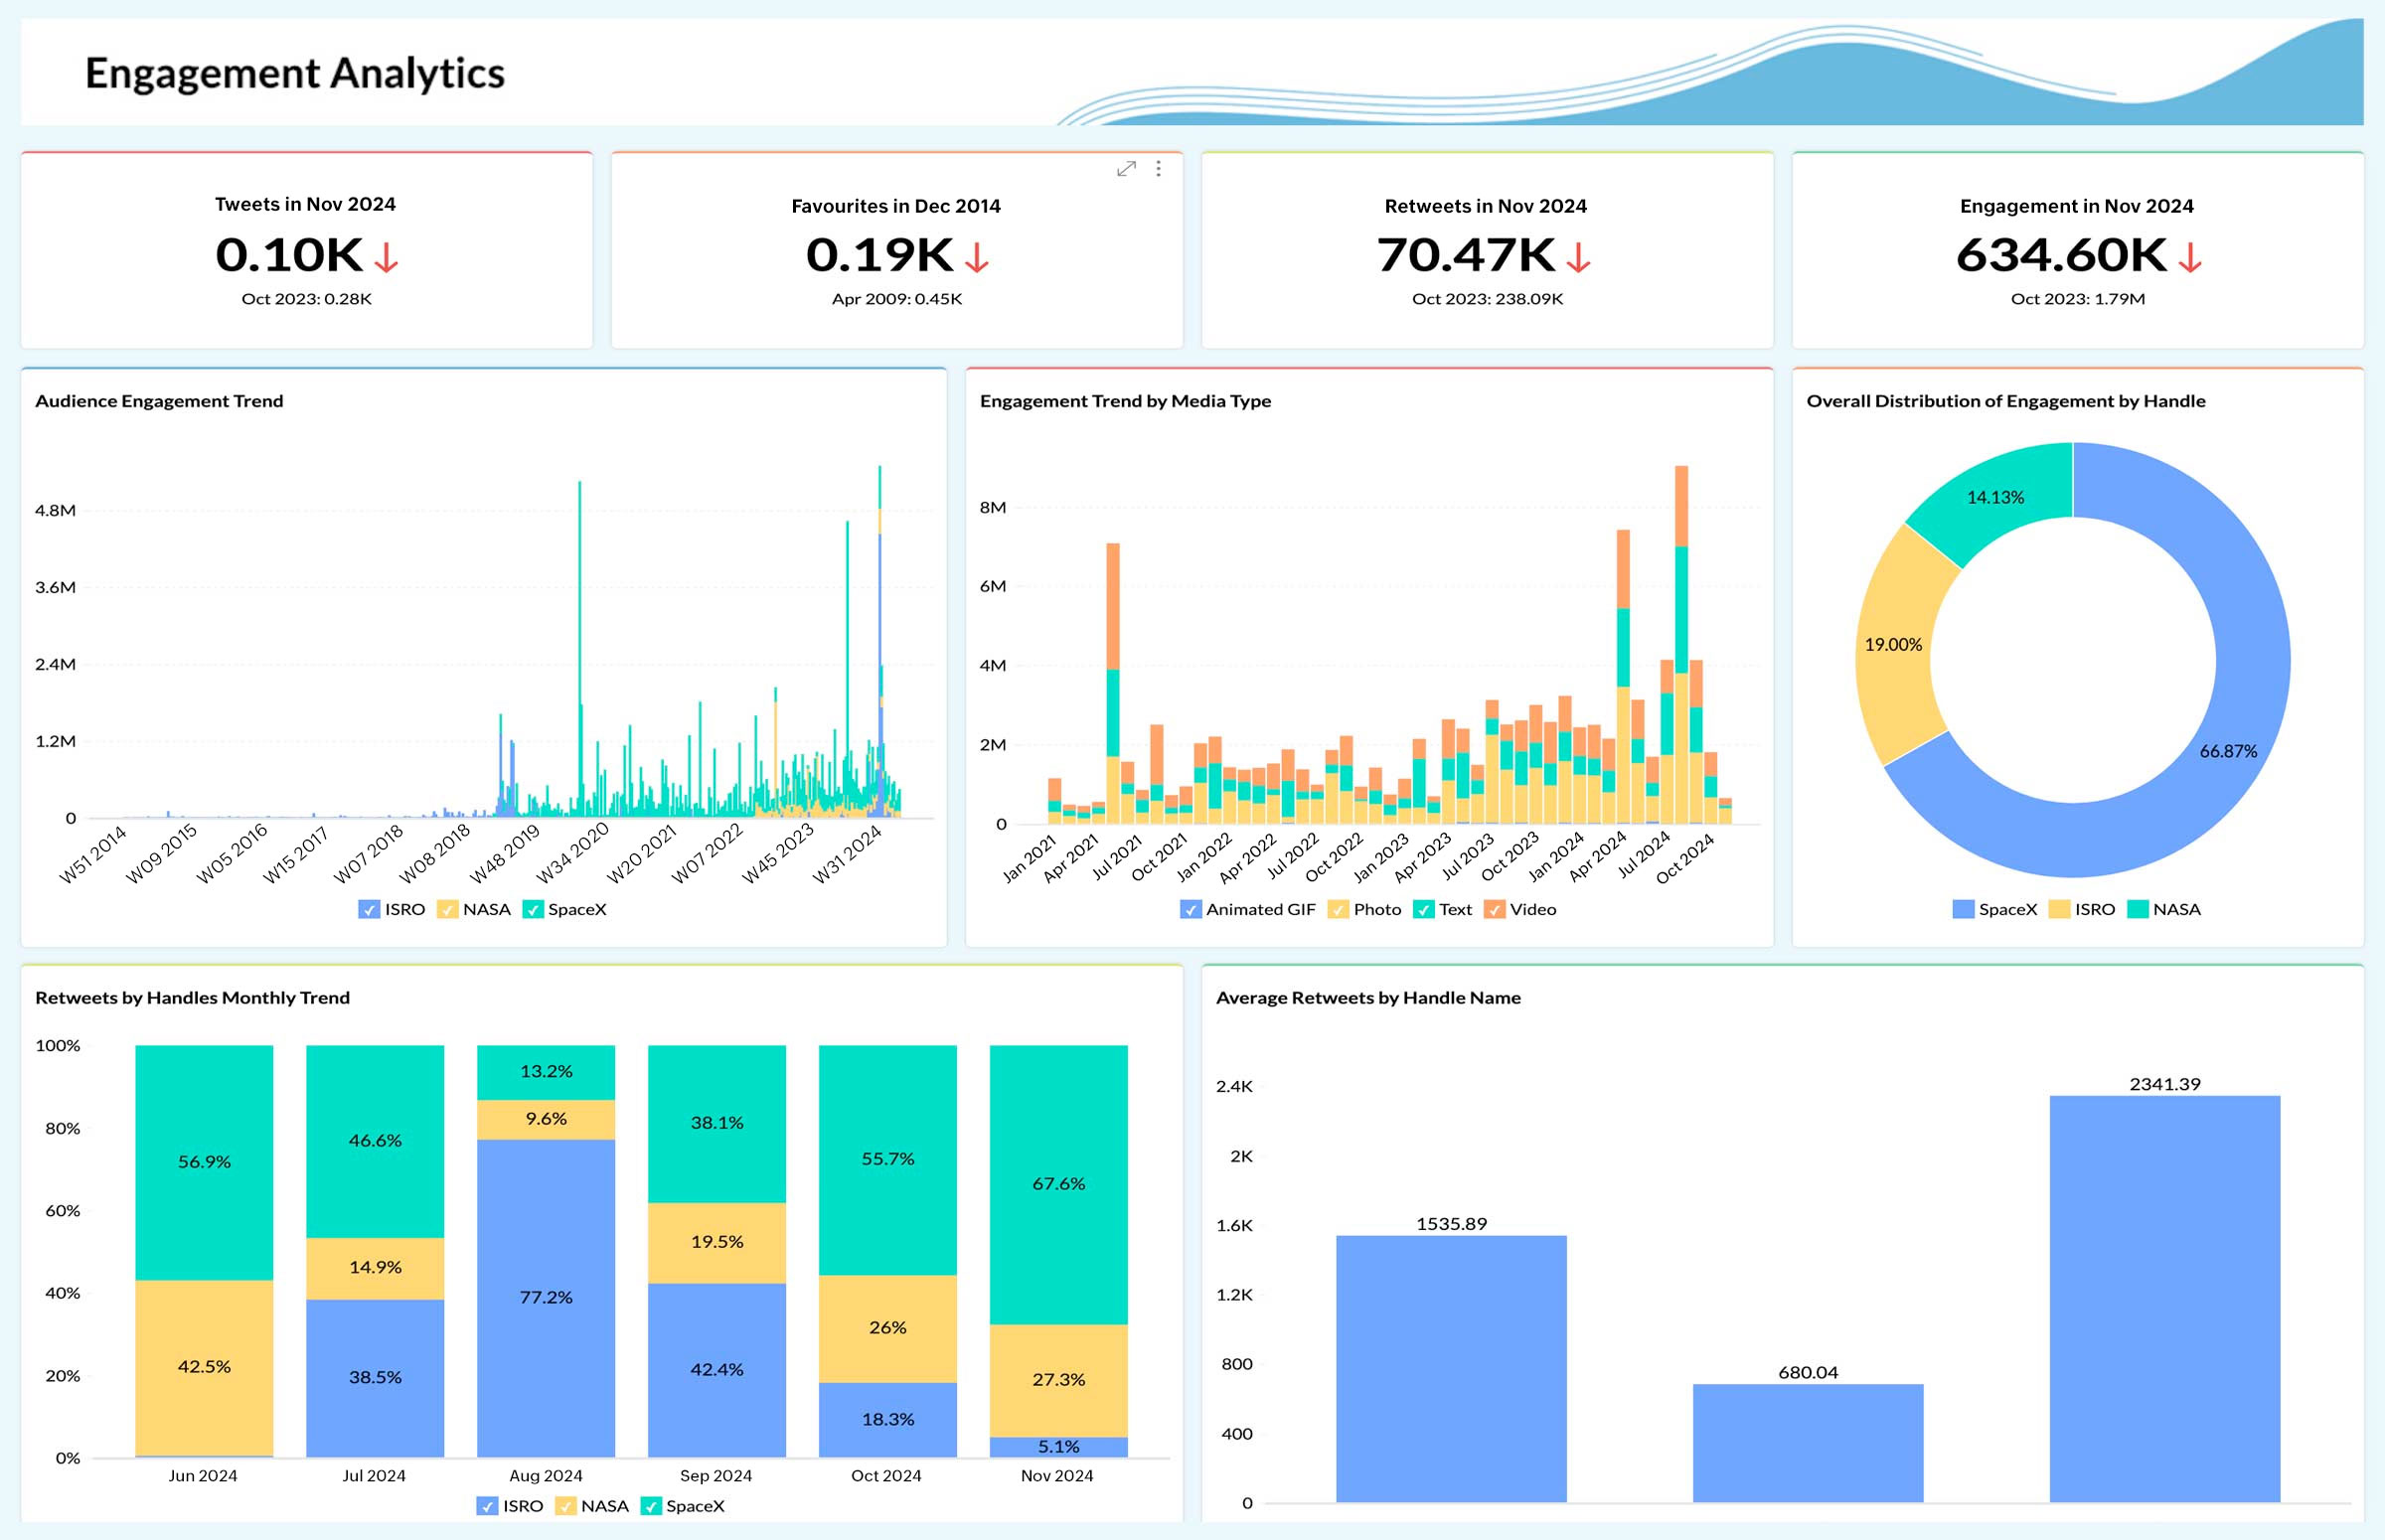
Get unique insights by just going through the default set of dashboards that Zoho Analytics provides.
Analyze tweets that got the best engagement
Drill down into a particular X handle by month, week, day. See which tweets got the most likes, were the most retweeted, and got replied to the most. Use the learnings to craft your own strategy.
Know which format works the best for whom
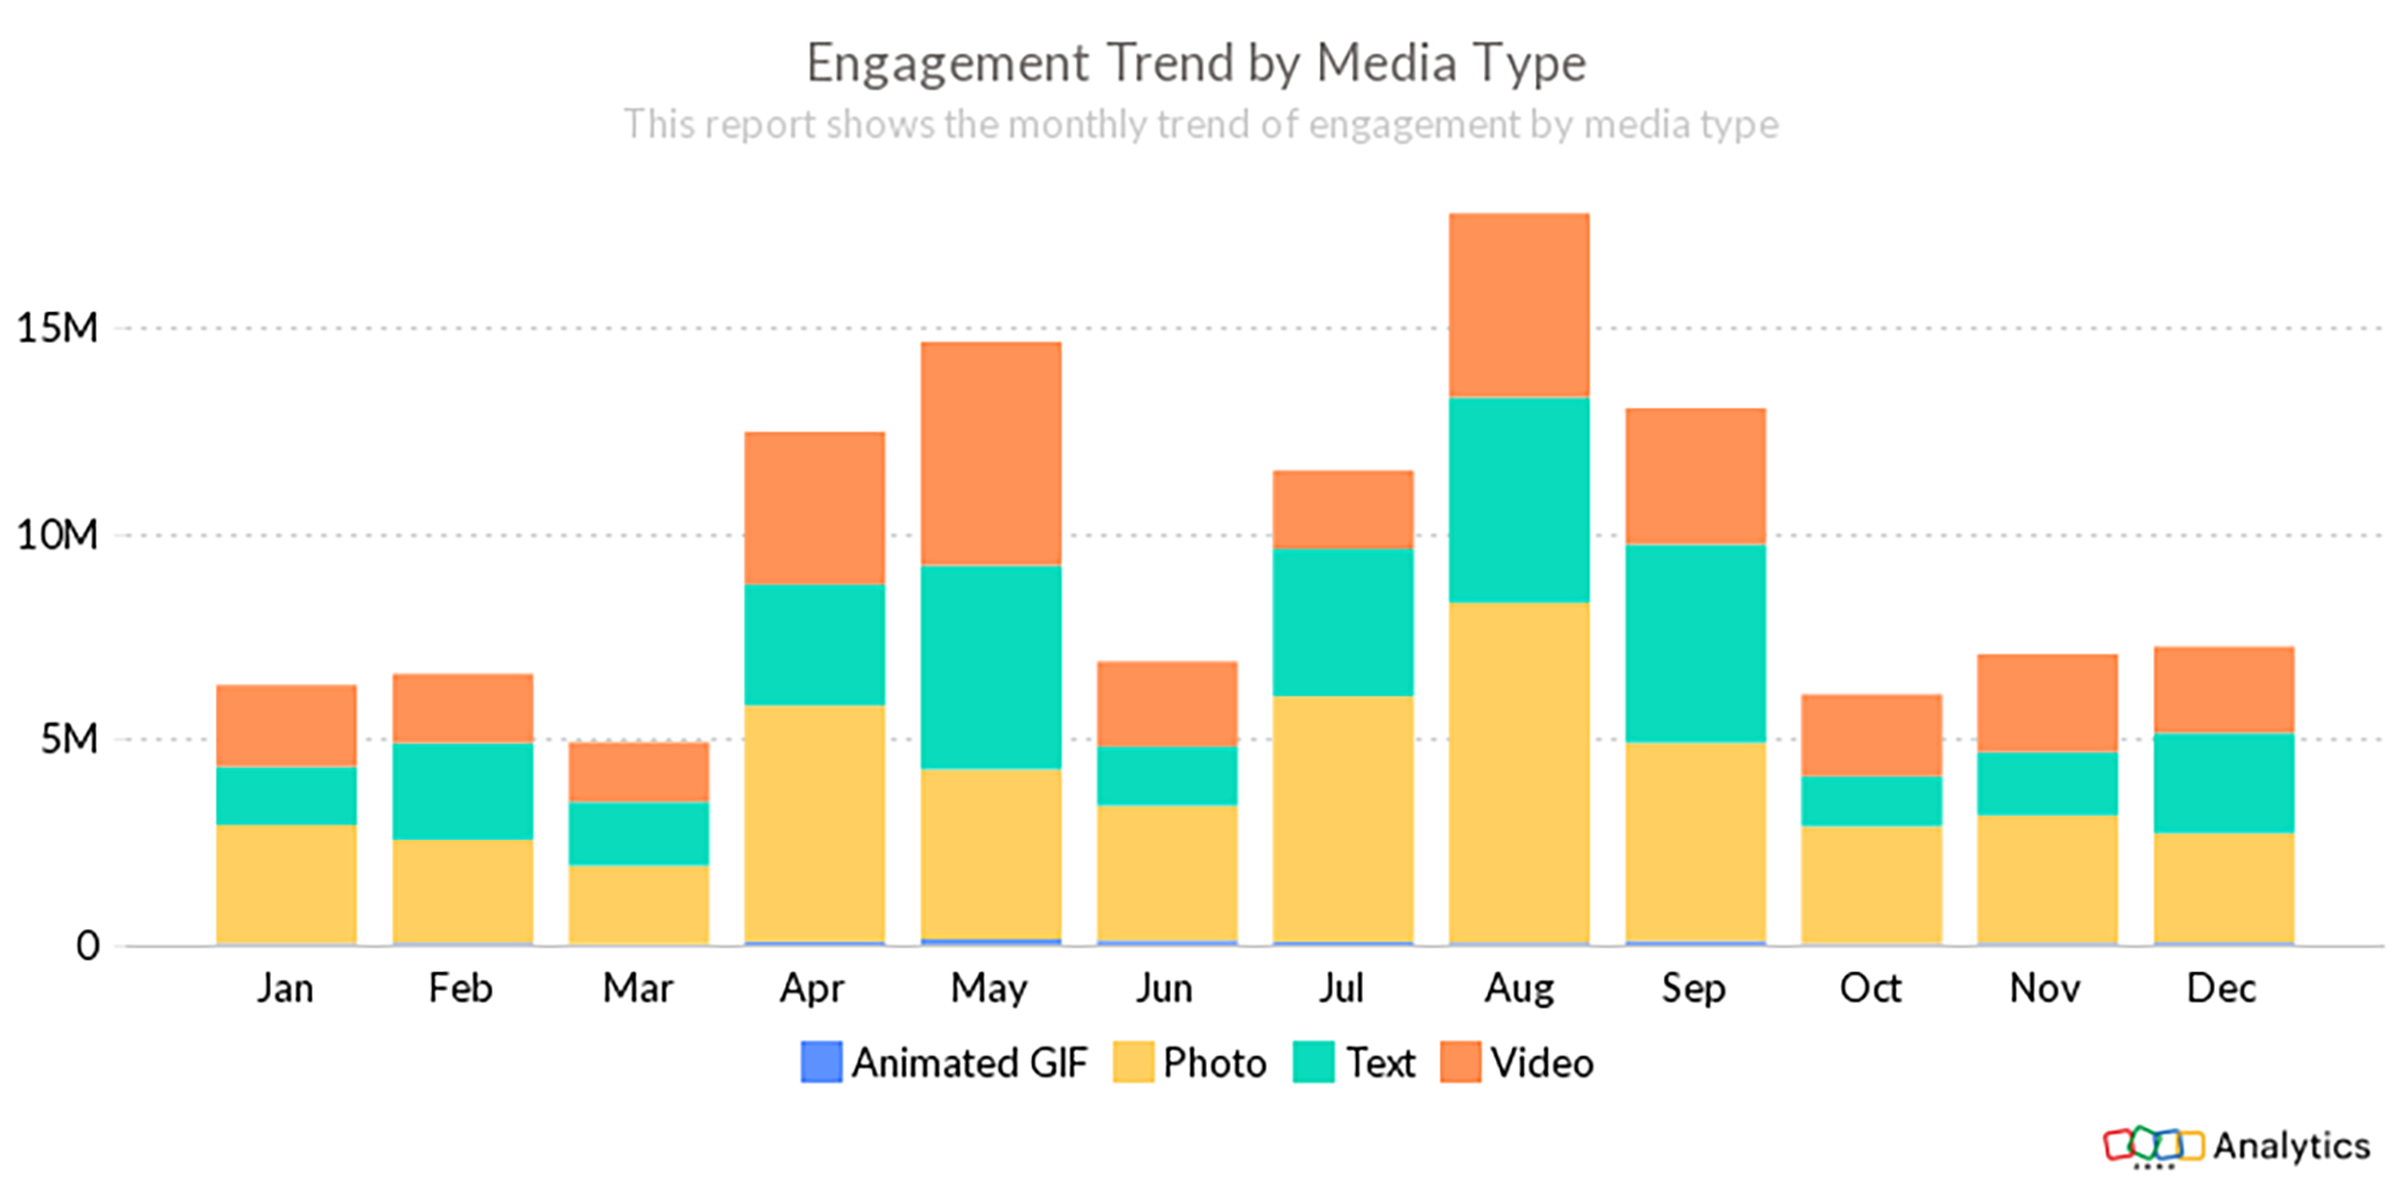
Analyze the engagement trend by media type. See which of the formats - text, photo, video, animated gif - will work best for you.
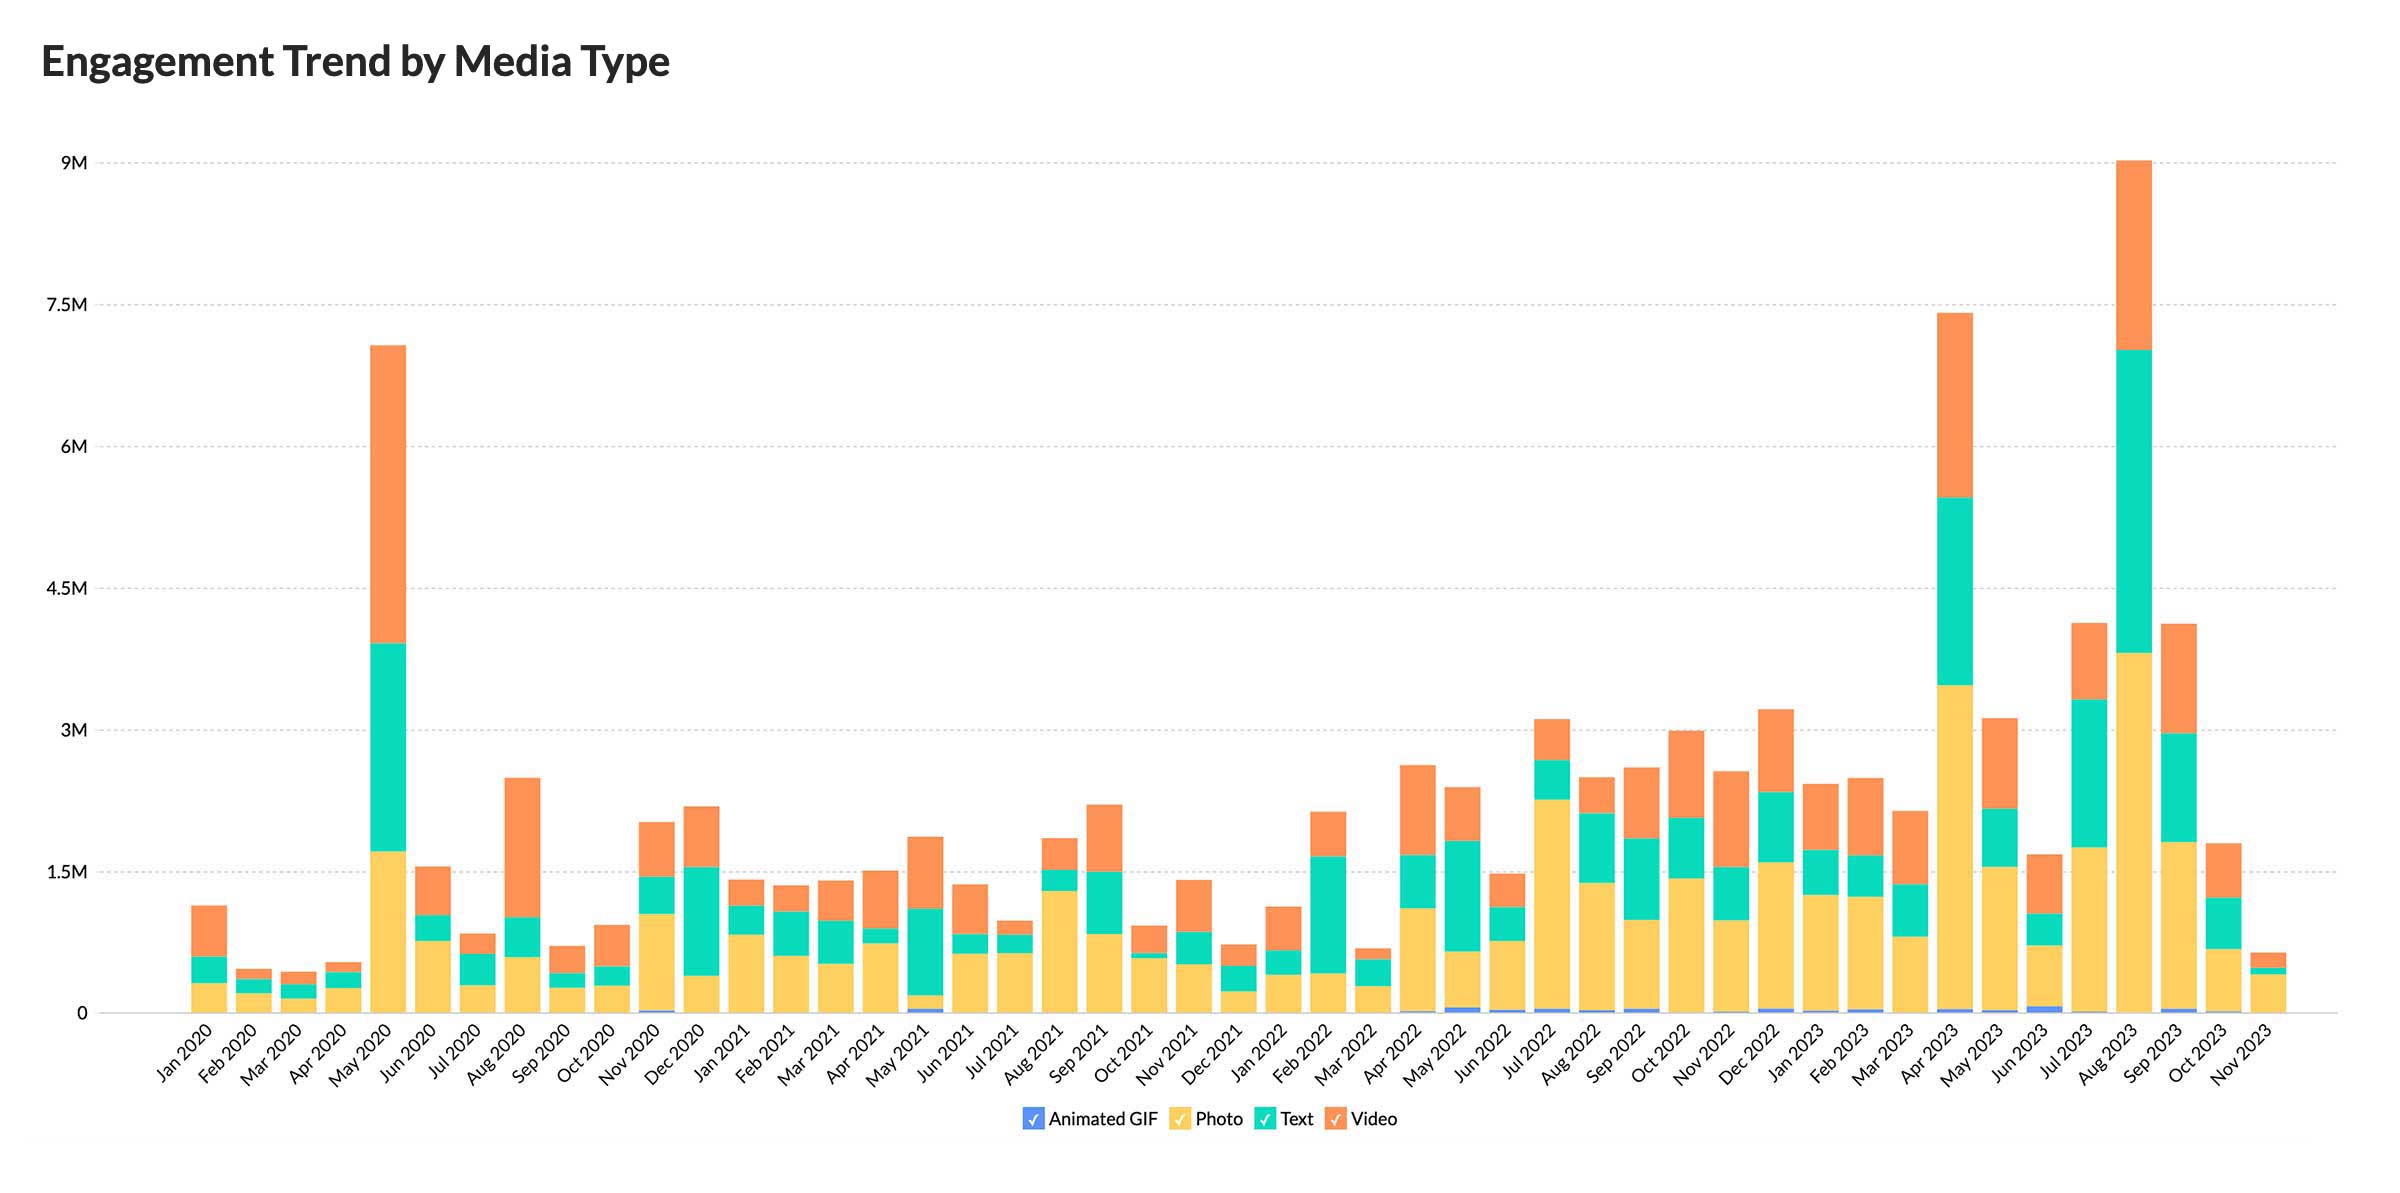
View engagements trend by media type
See what kind of media type tweets (text, photo, animated gif, or video) each handle posted over months, and the engagements each of them got.
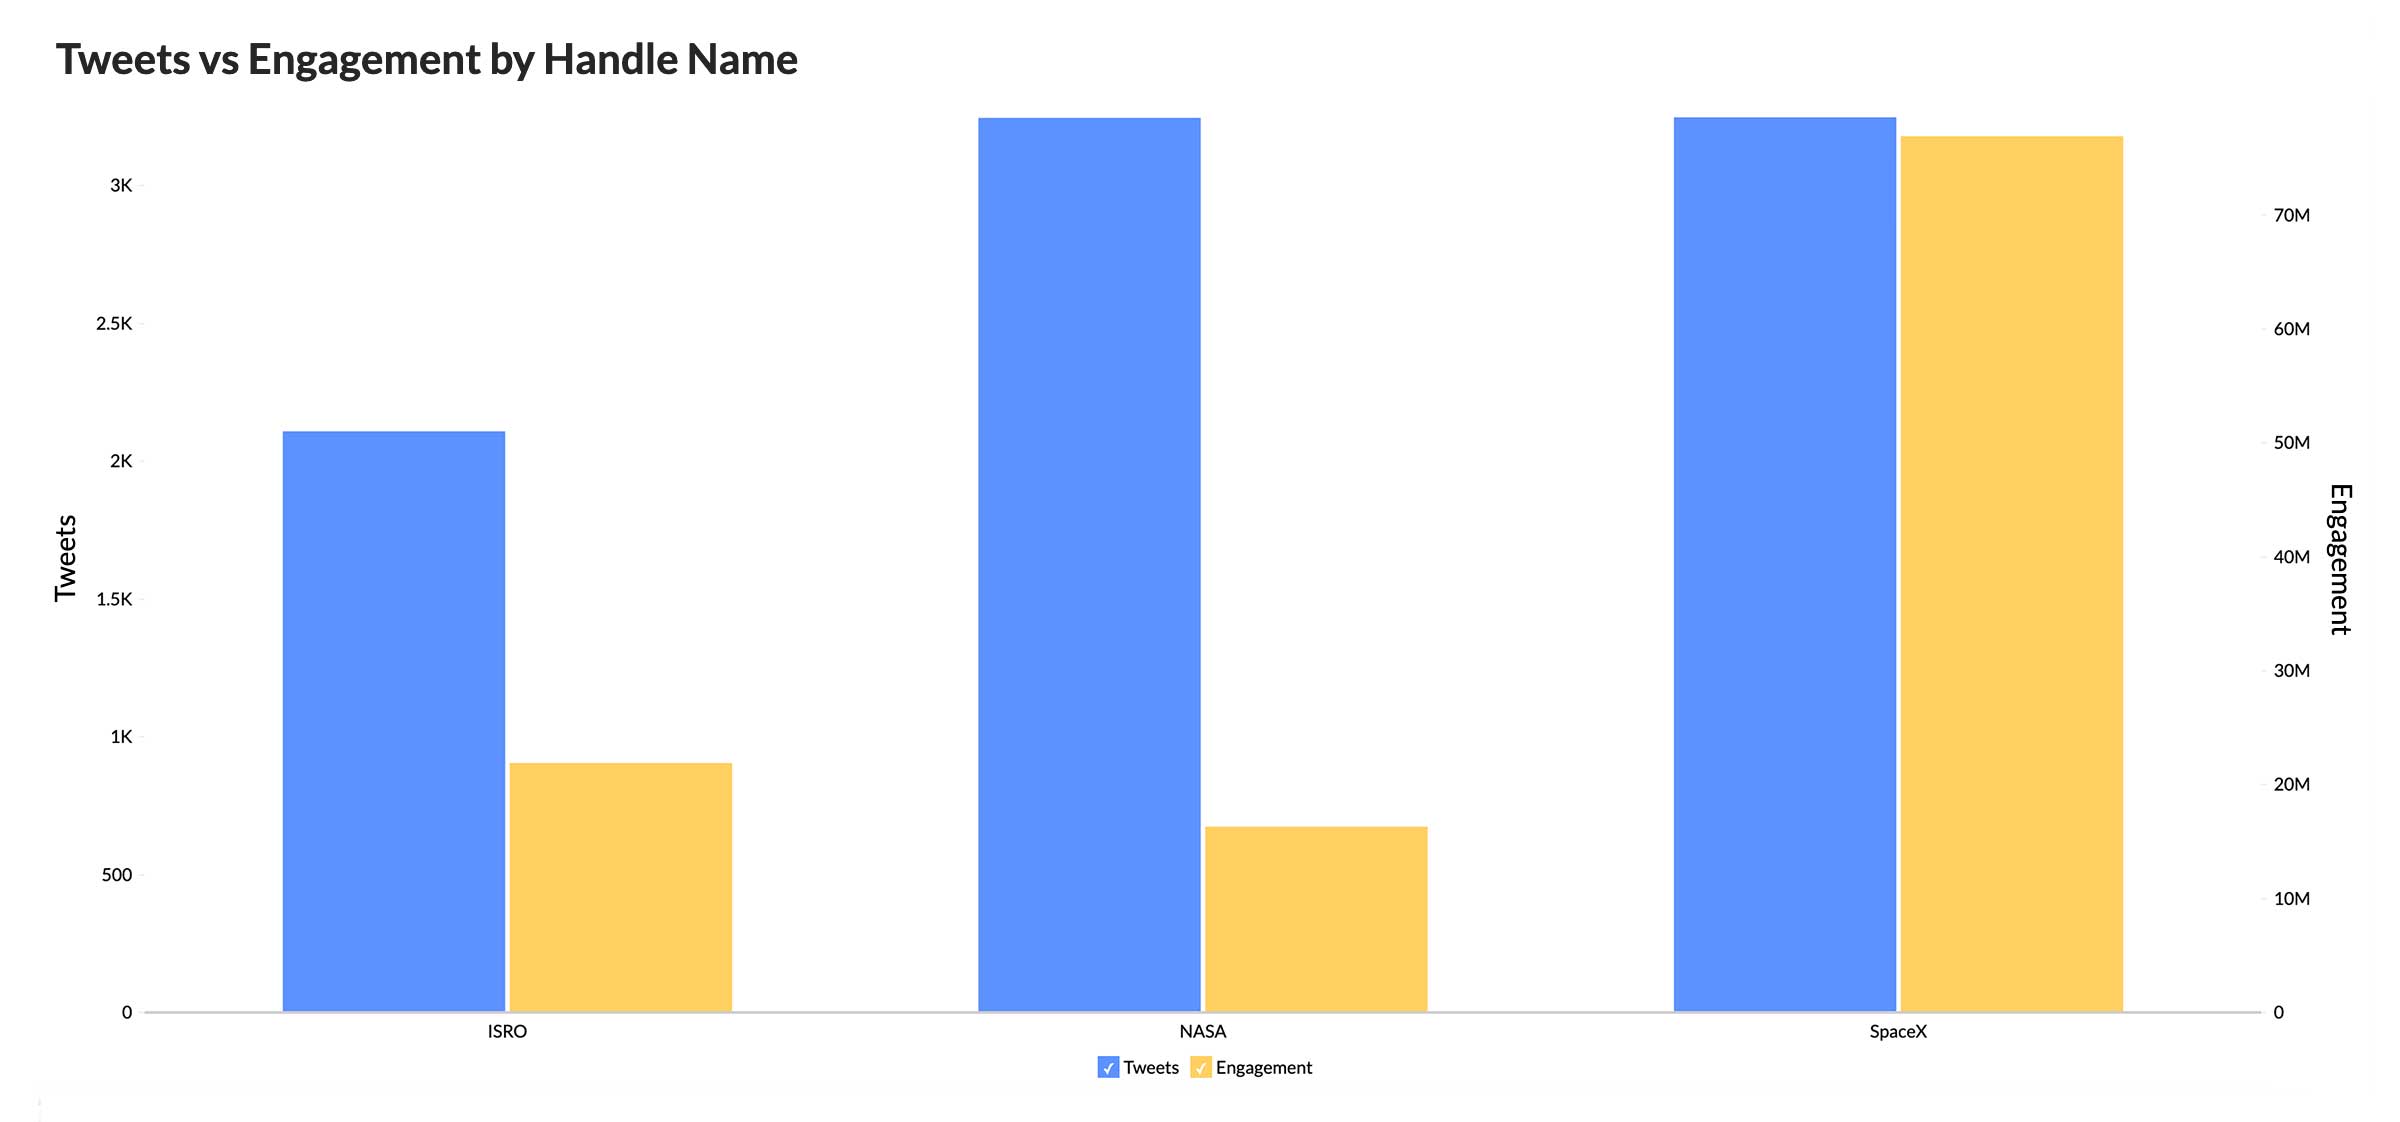
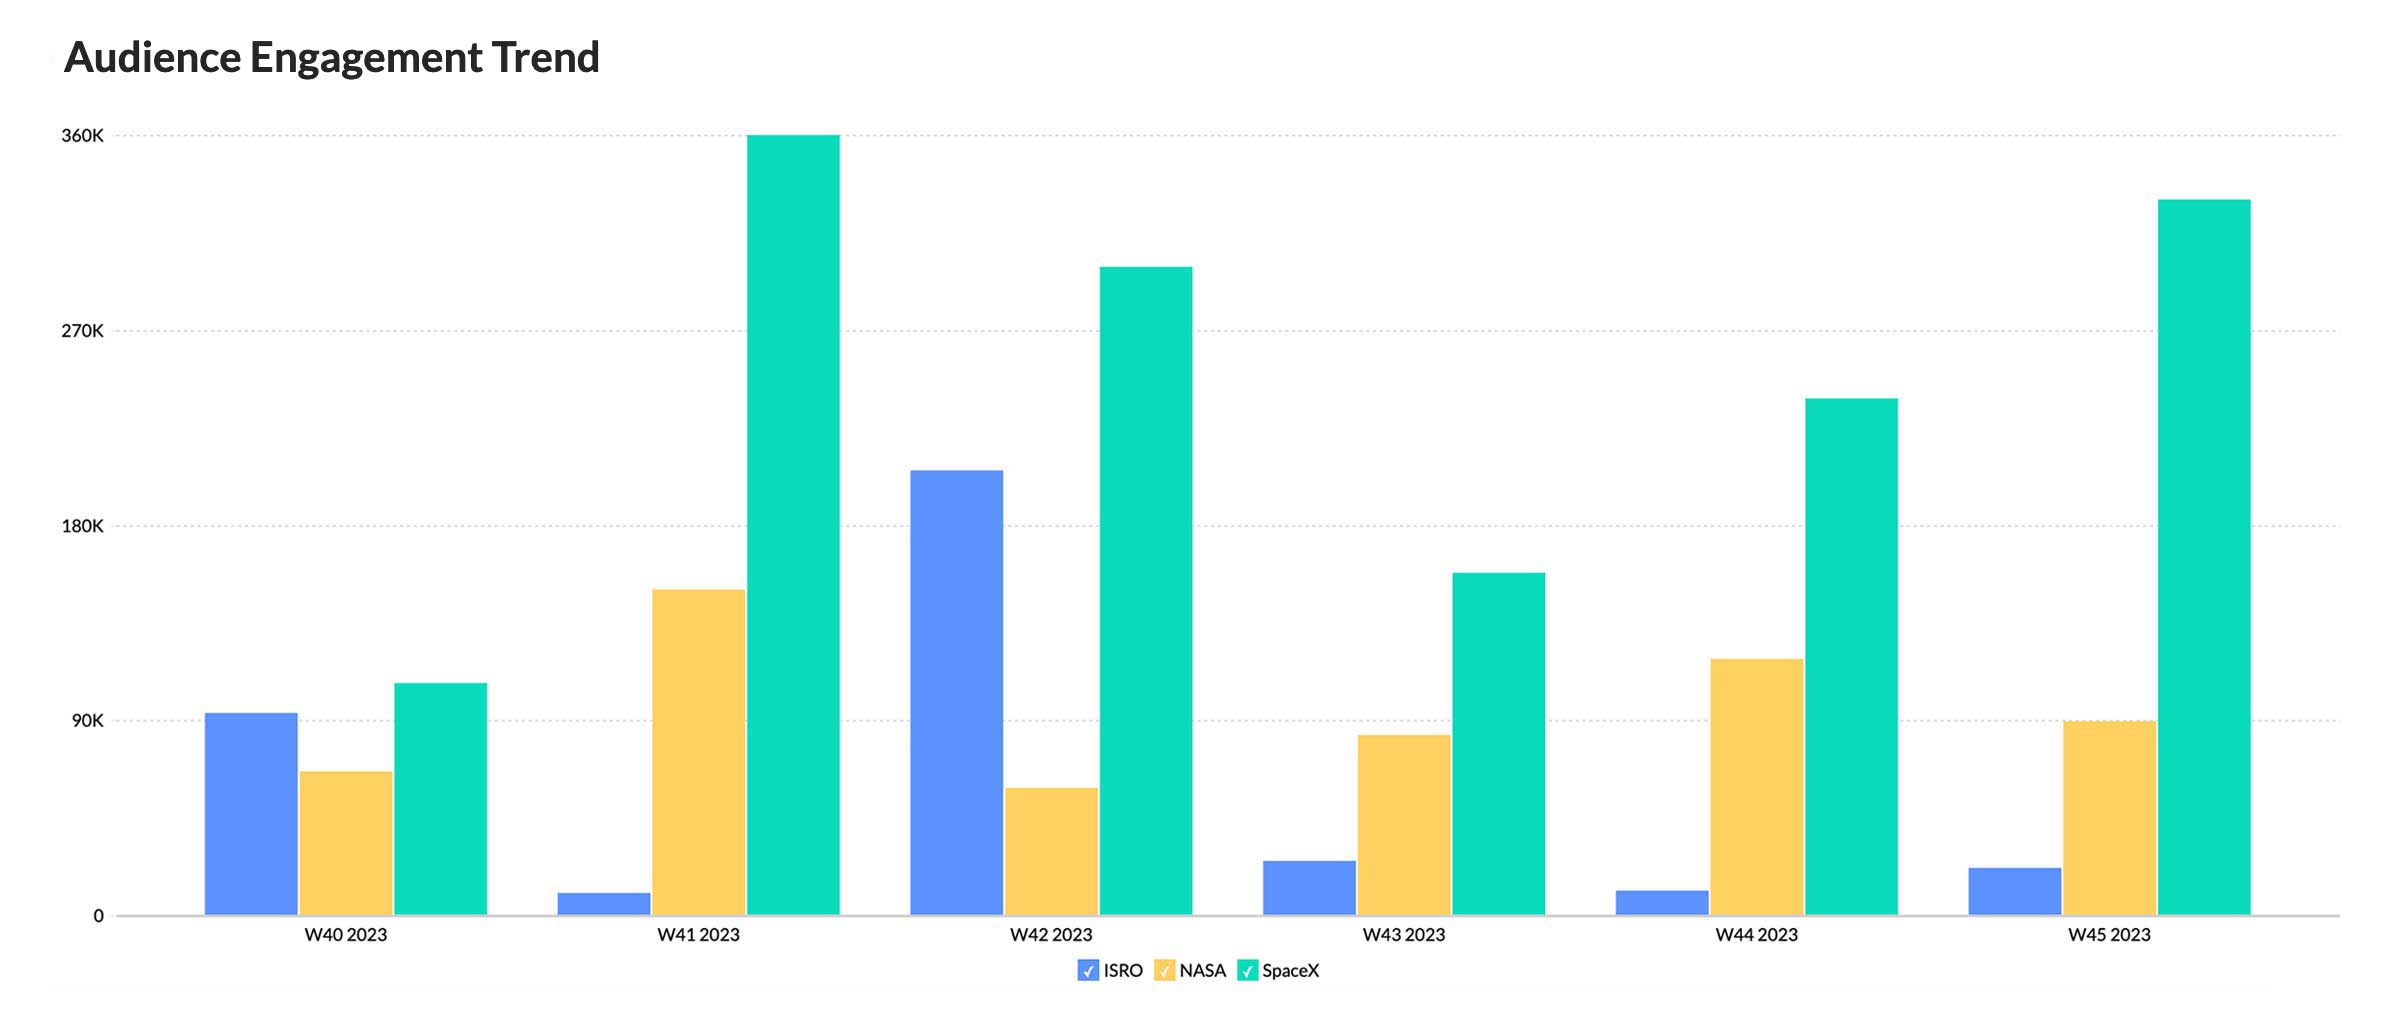
Know who gets better engagement
Compare each handle's tweets with engagements. See who performed better.
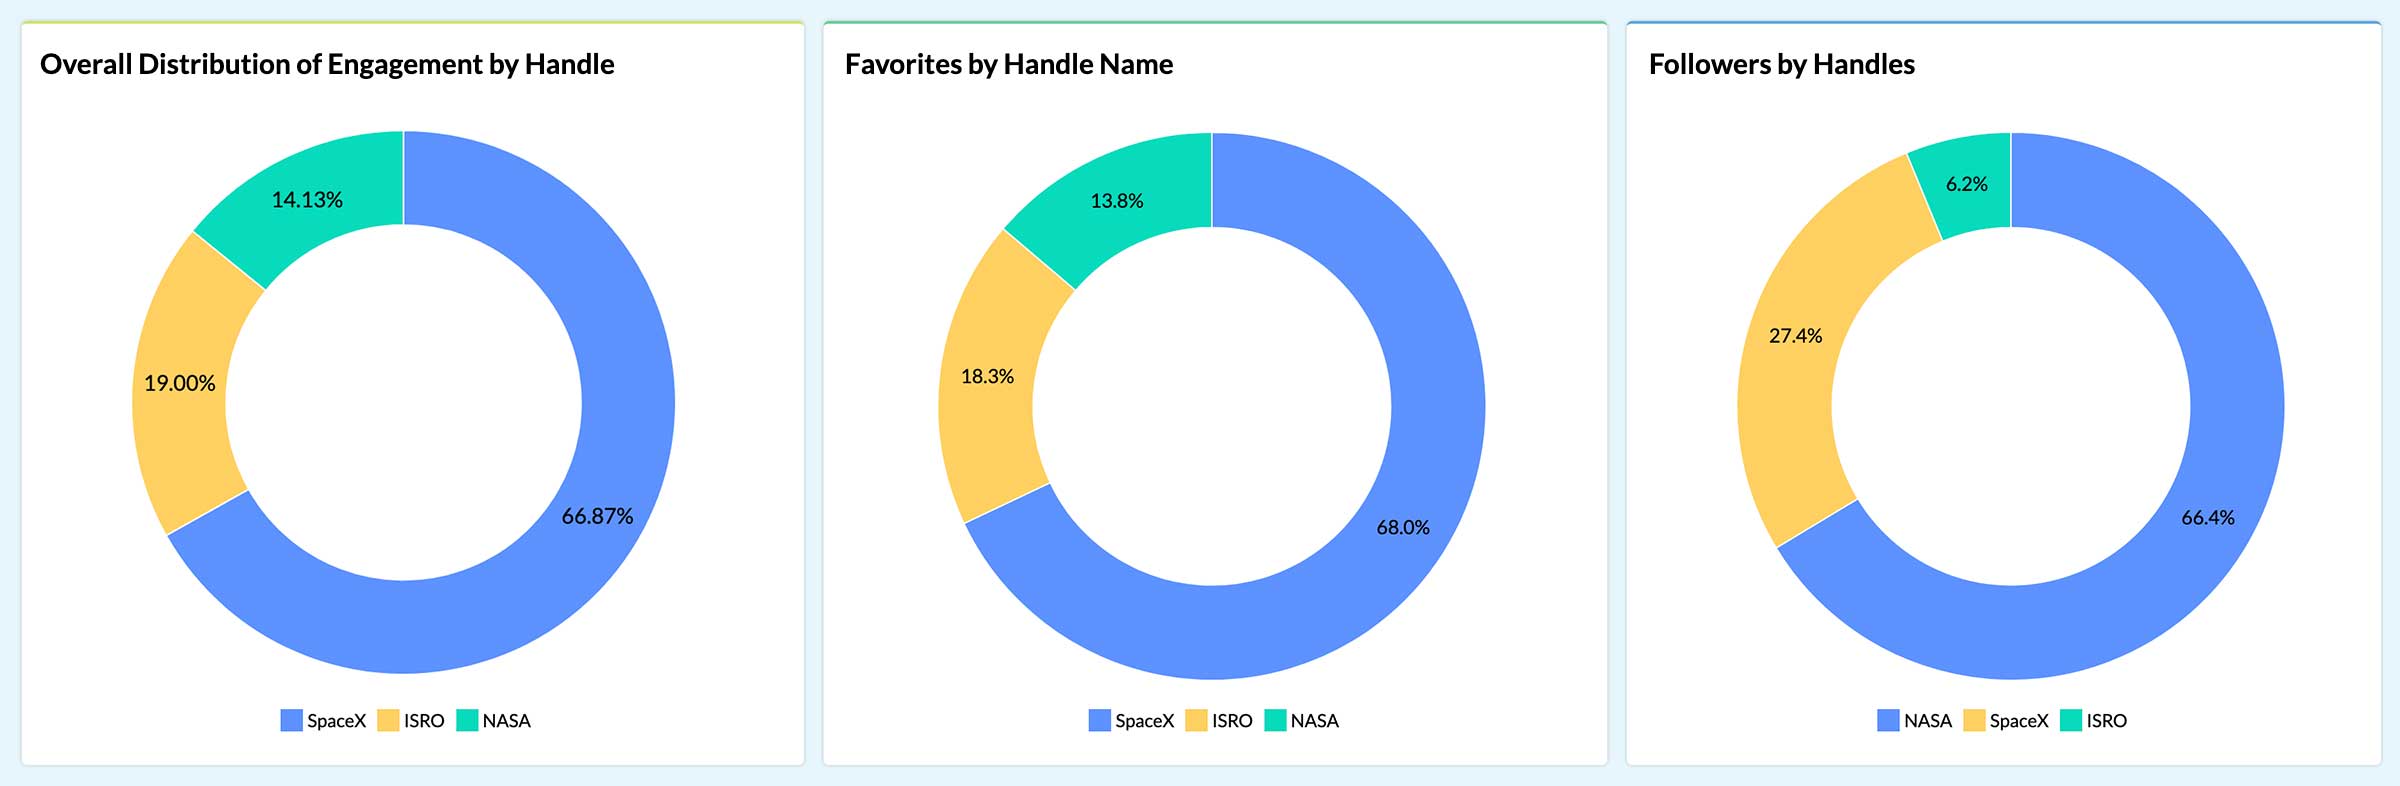
Compare Followers, Favorites, Engagements
Easily compare and see which handle scores the most when it comes to followers, favorites, and engagement got.
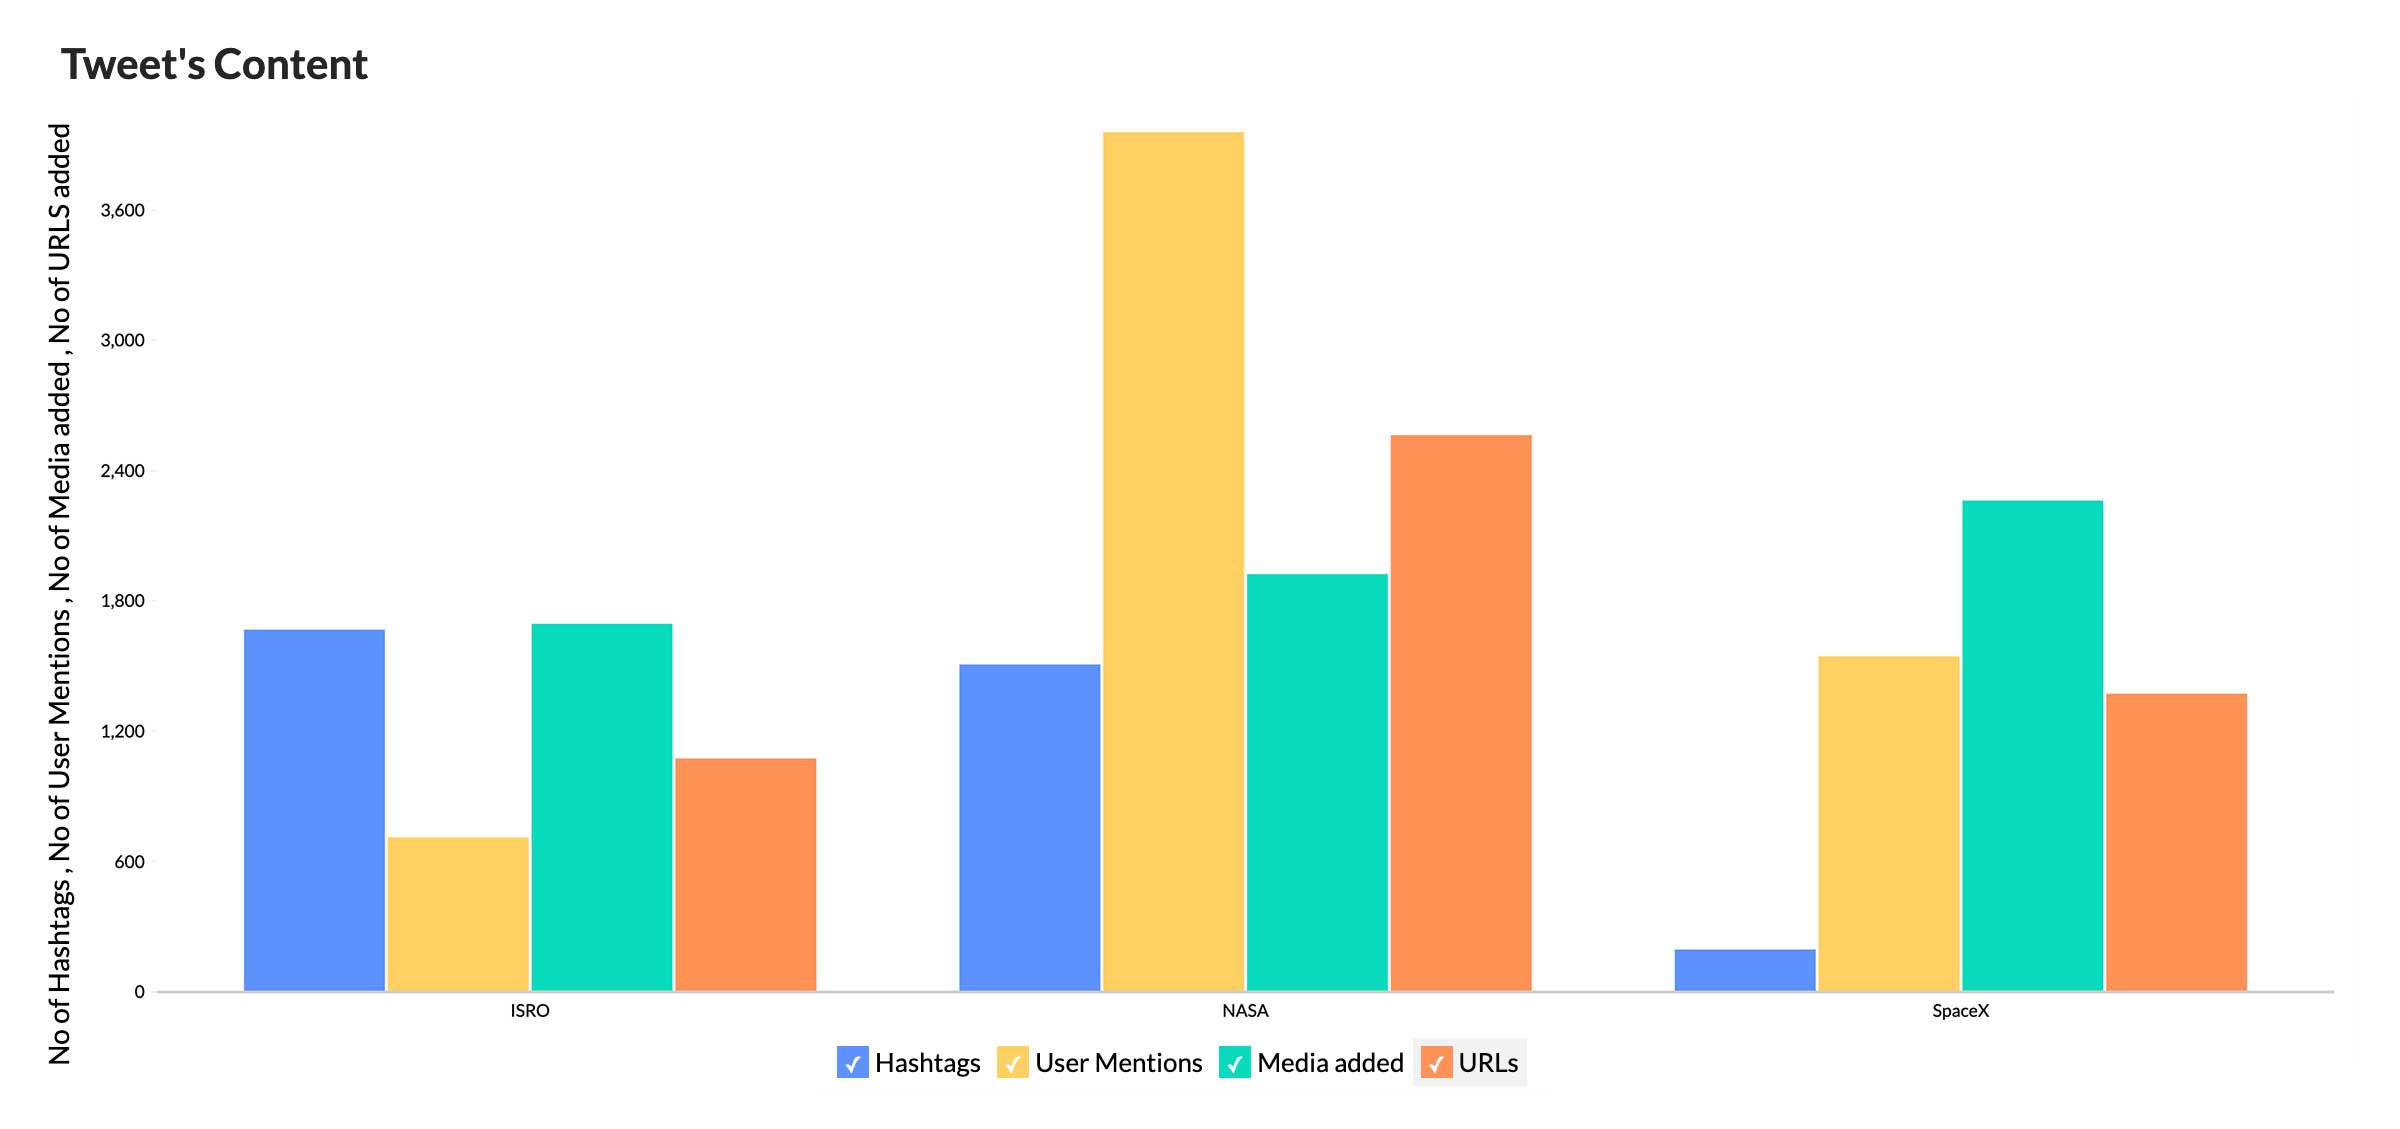
Compare tweet content types
Get to know what the tweets of the various handles contained - how many hashtags, user mentions, media, URLs each of the handles posted.
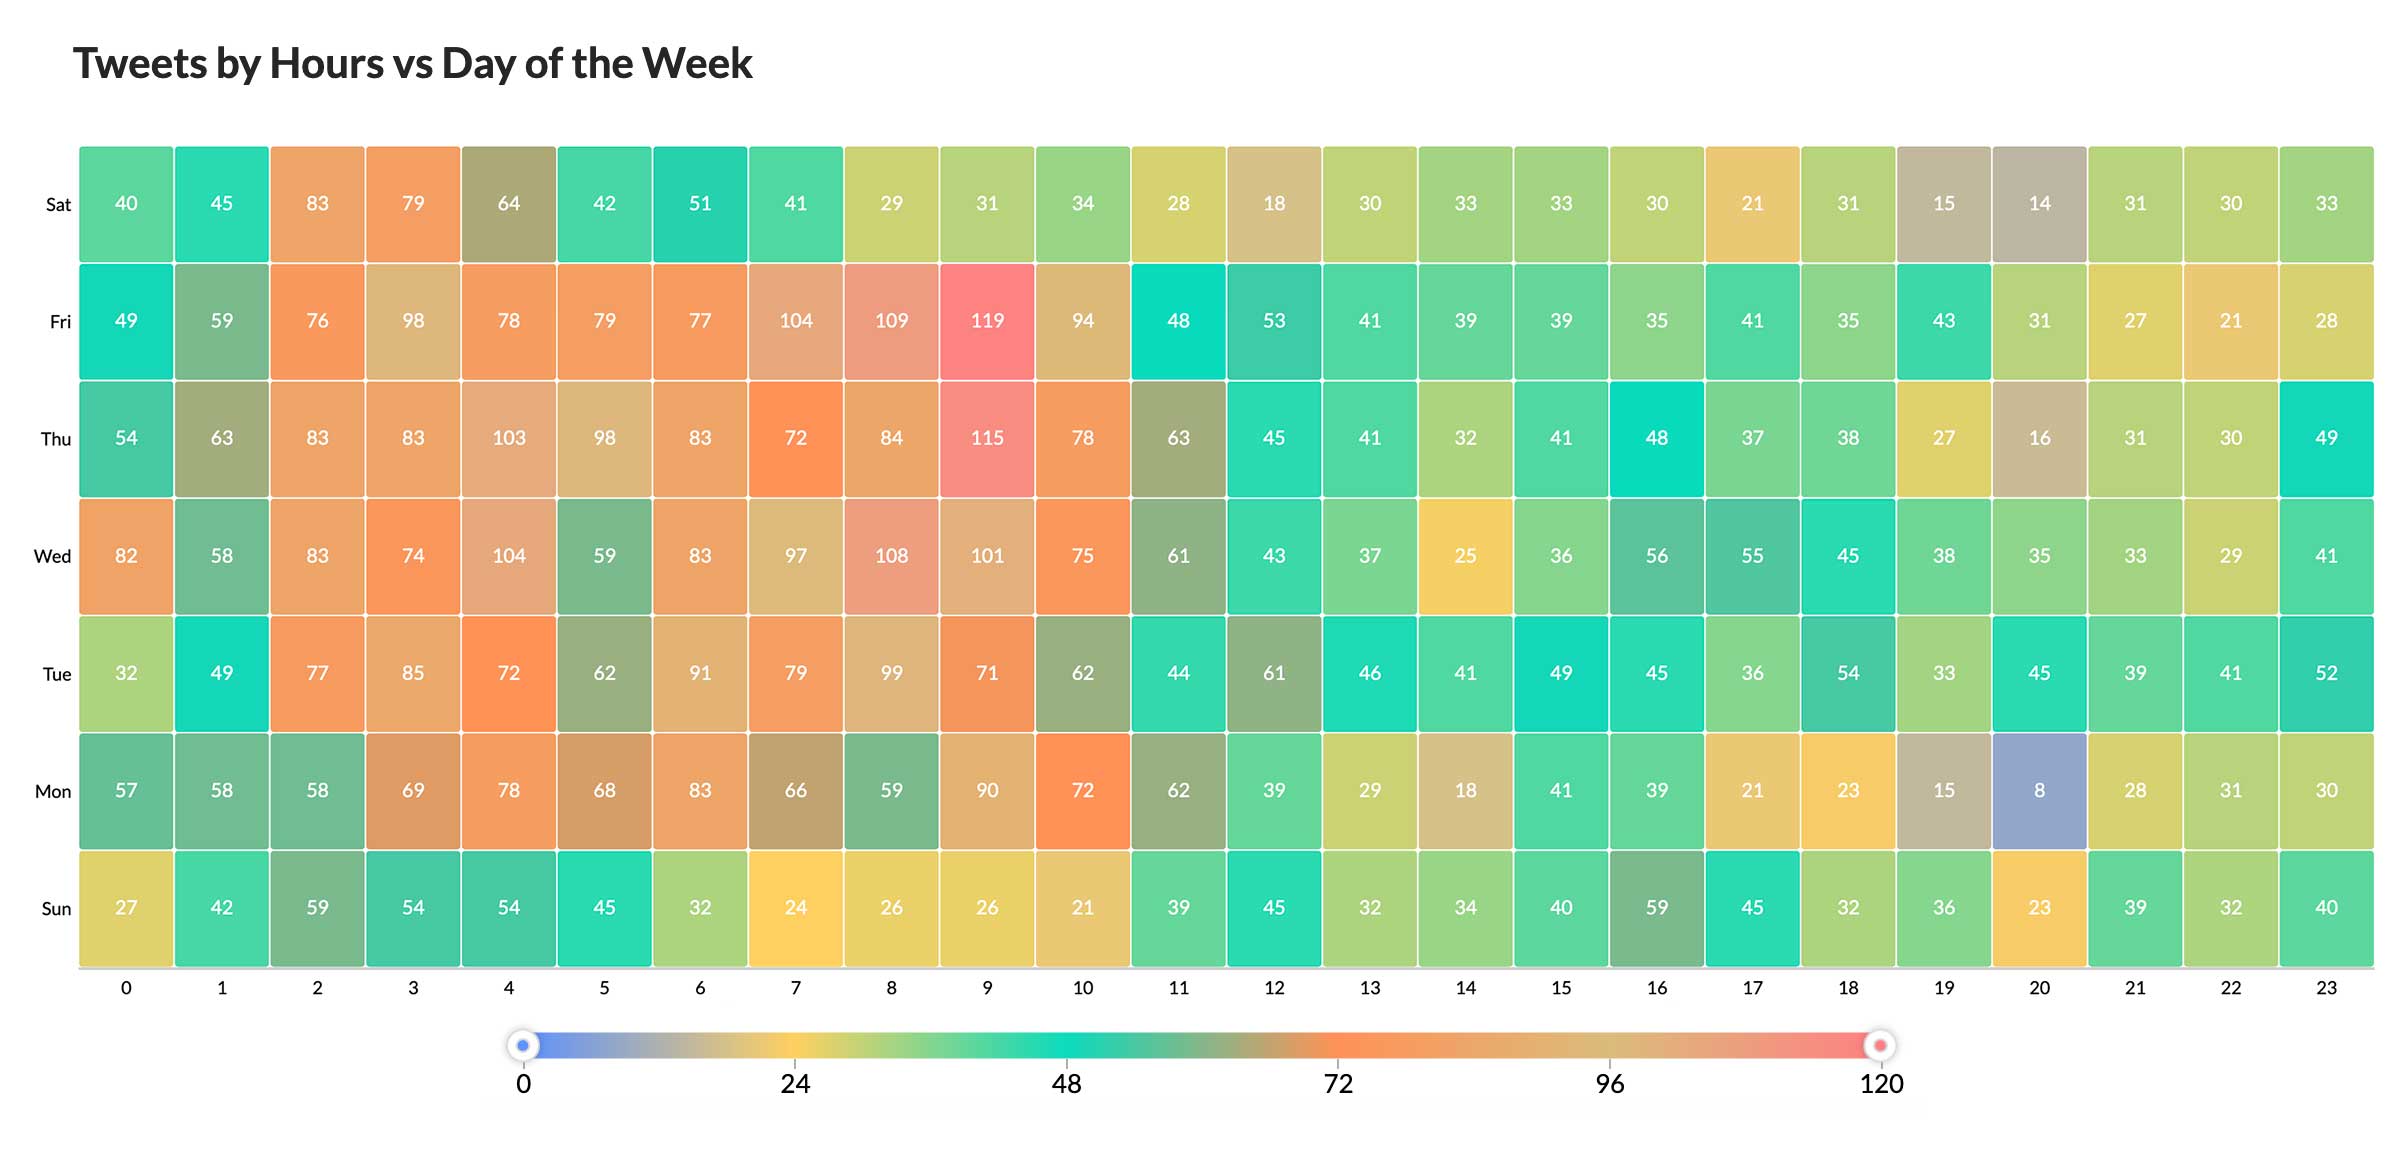
Visualize the tweets as a heat map
Know which parts of the day and week, the most and the least number of tweets were made, as a heat map.
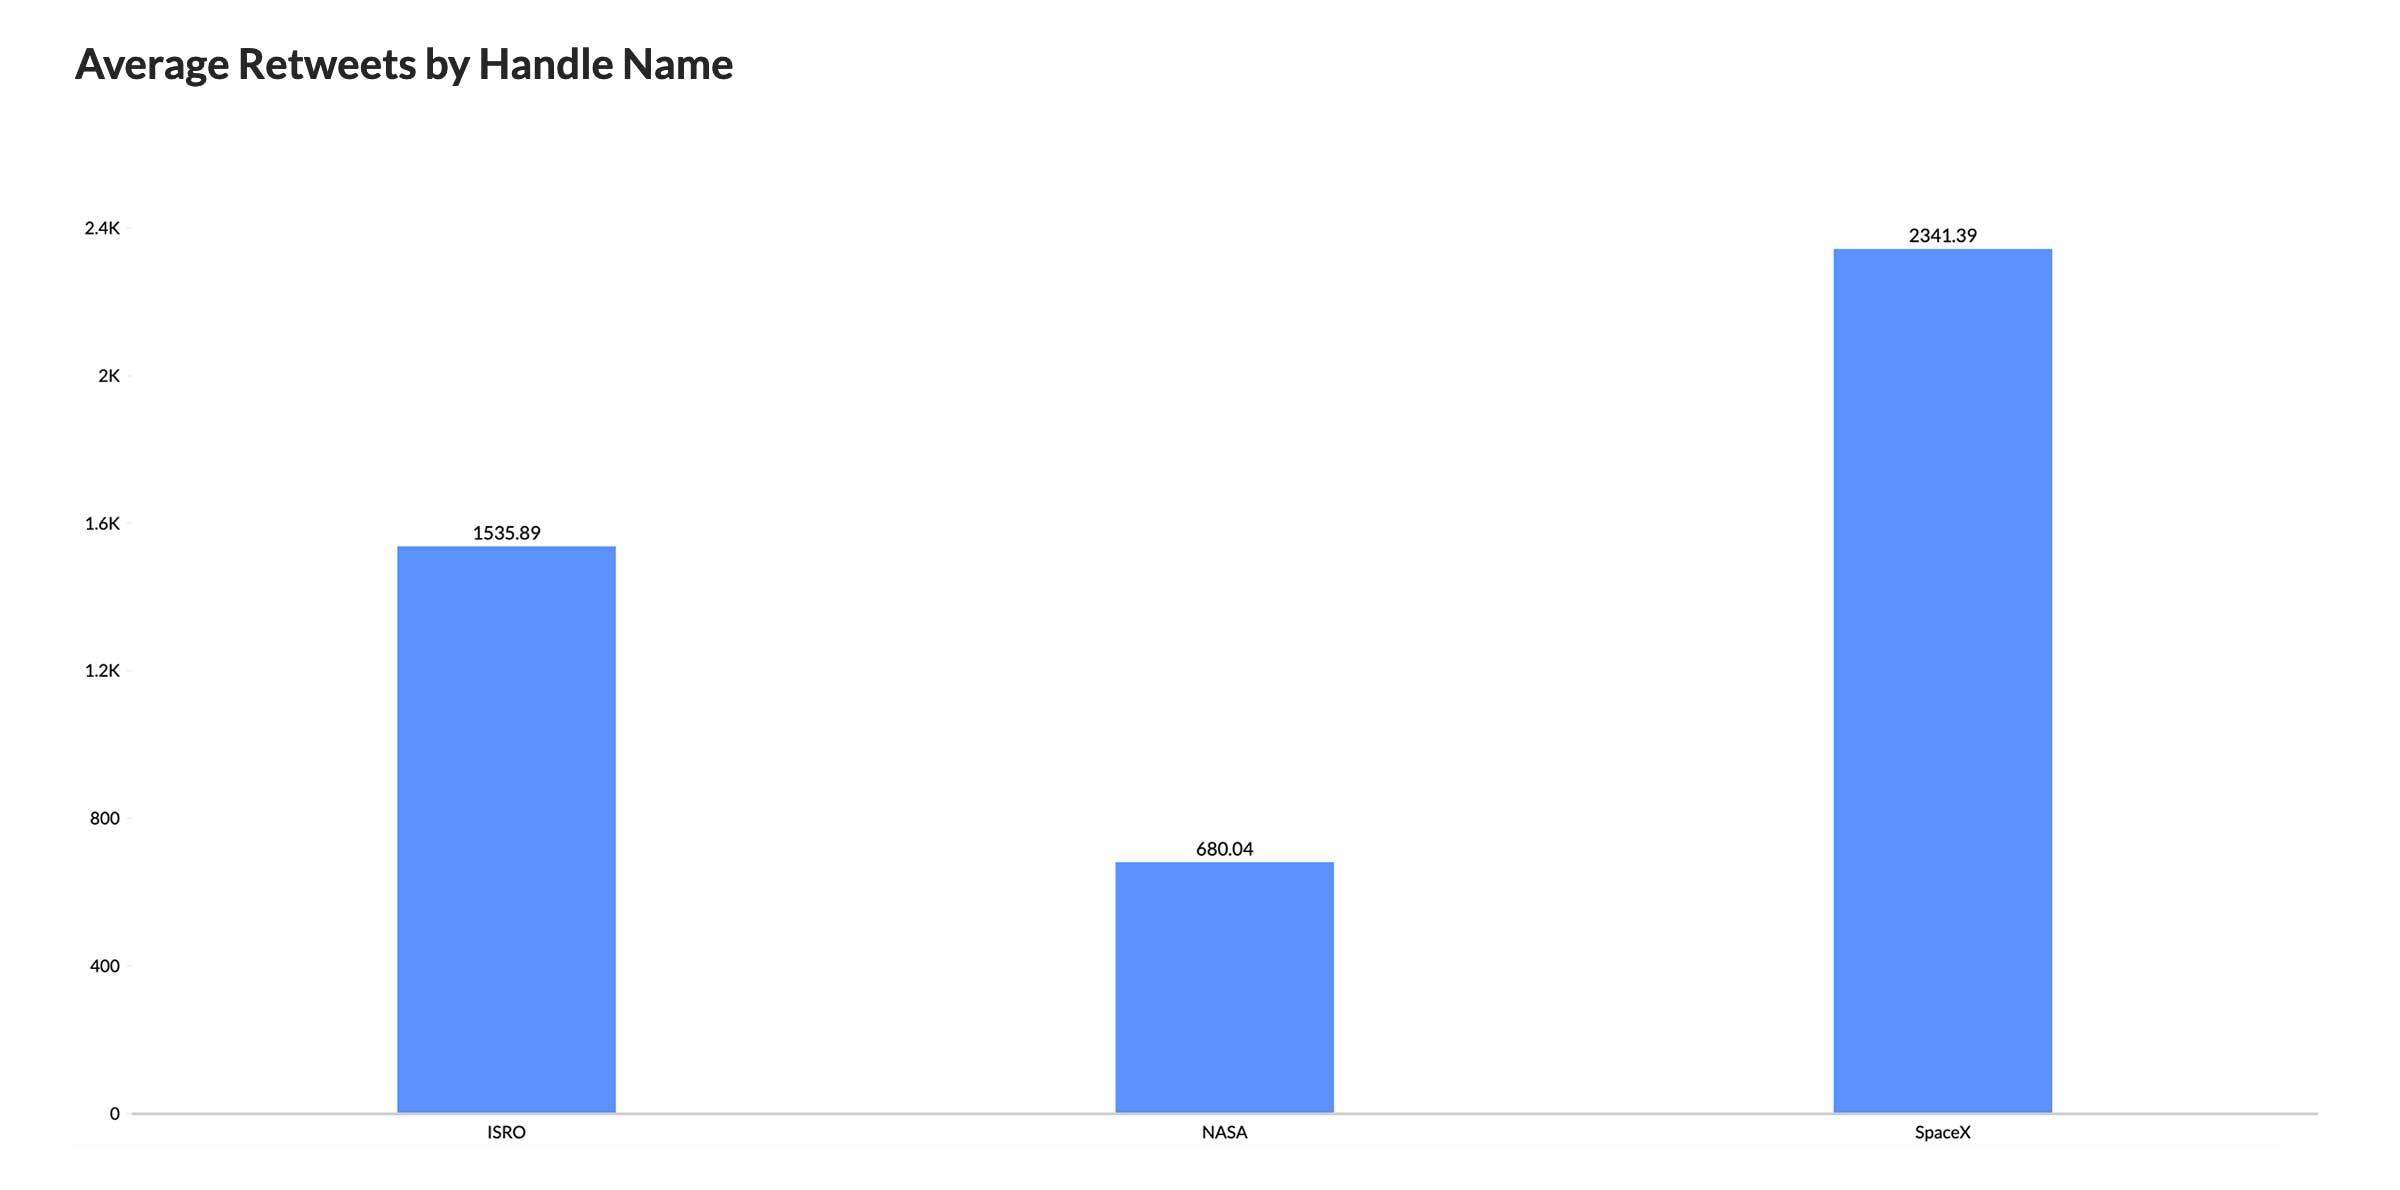
Compare retweets of each handle
Compare the average number of retweets each handle received. The more the retweets, the better the handle is capable of generating viral content.
Related Analytics for Social Media and Marketing
VIEW MOREHear from our Happy Customer
"With Zoho Analytics, we get precise insights on which store has the highest sales, and which styles are more preferred by our customers, by city and by state. We also have good visibility on the exact stock levels in each of the leading multi-branded stores across India on any typical day. These were not possible before."

Rupendra Nigam
Vice President of IT, Spykar Lifestyles