Dynamic data visualization
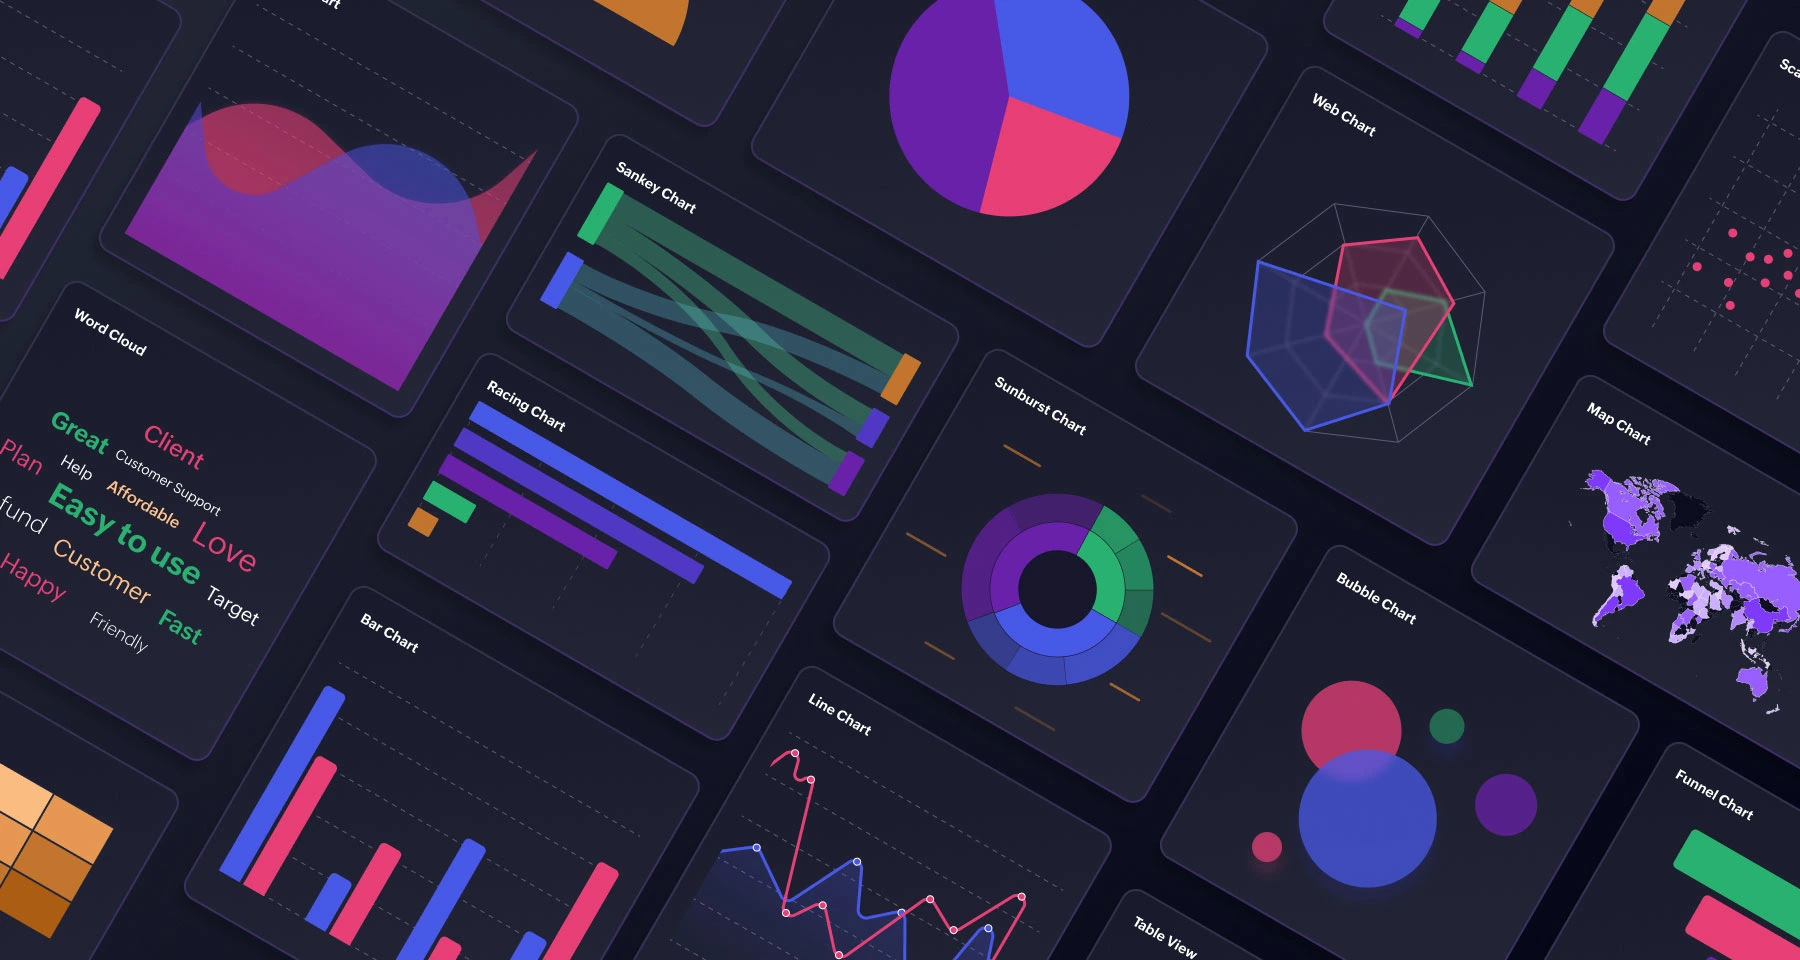
Create stunning visualizations from your Microsoft SQL data. Zoho Analytics offers a wide range of charts, summary views, pivot tables, KPI widgets, and dashboards, making data interpretation a breeze.

In-depth data analysis
Zoho Analytics is not just about data visualization. It allows you to perform complex calculations, apply various filters, and even create derived columns using formulas. Use predictive analytics and machine learning features to anticipate future trends and make informed decisions.

Collaborative data sharing
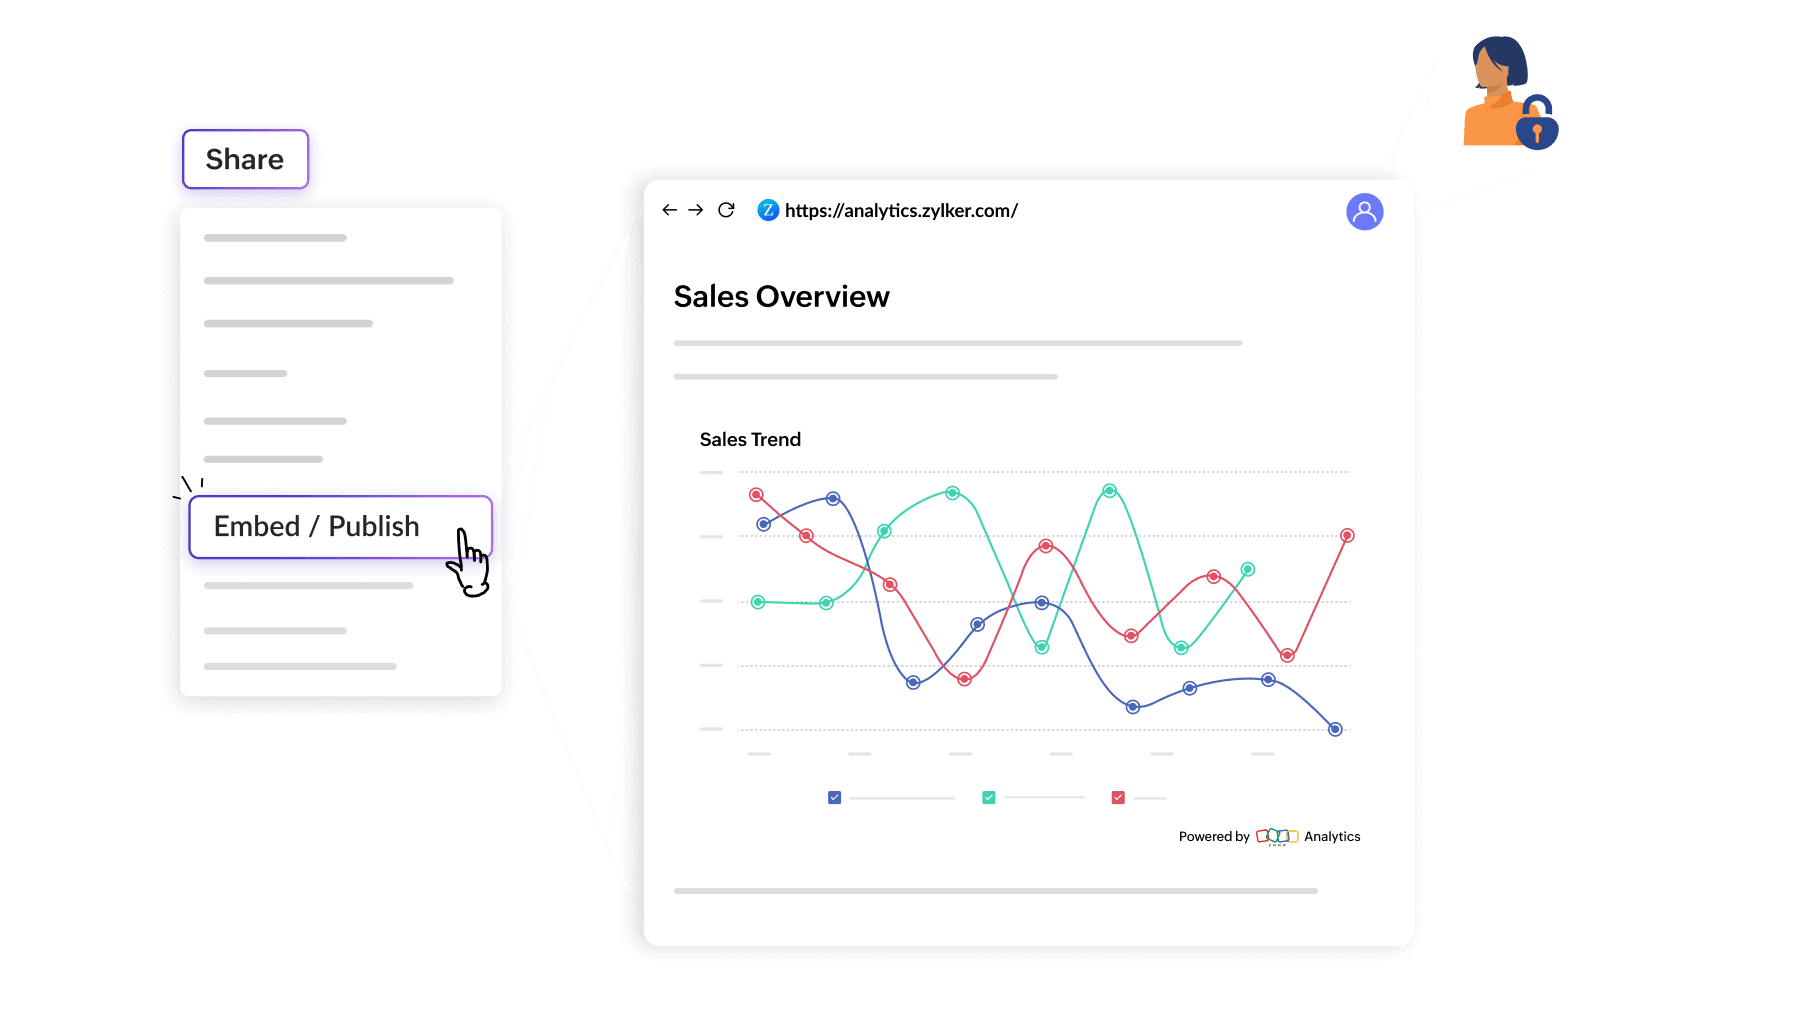
Transform your data analysis into interactive dashboards and reports that can be shared across your organization. With Zoho Analytics, your team will always have access to the most current data from your Microsoft SQL database -- without the clutter.

Leverage the power of your Microsoft SQL data with Zoho Analytics.
Transform your raw data into meaningful insights that can drive your business forward. Begin your data visualization and analytics journey with Zoho Analytics today and experience the difference.

Our Customer love us

Co-founder, Tutorez
